1) Natural geography
Environment
|
Area > Comparative to US places slightly smaller than Maryland |
||
| Capital city with population | Kigali - 851,024 | |
| Forested Land | 12.4% | [139th of 193] |
| Geographic coordinates | 2 00 S, 30 00 E | |
| land border lengths > P-S > Number of neighbours | 4 | [13th of 26] |
| land border lengths > P-S > Total Borders | 893 km | [22nd of 27] |
| Largest city | Kigali | |
| Largest city population | 286,000 | [127th of 174] |
| Largest city with population | Kigali - 851,024 | |
| northernmost point > Latitude | 01°03'S | |
| Population density | 326.85 people per sqkm | [33rd of 256] |
| Population density > people per sq. km | 366.34 people/m² | [19th of 204] |
| Precipitation | 1,028 mm | [32nd of 95] |
| Rural population density > rural population per sq. km of arable land | 605.01 people/km² of arable lan | [38th of 188] |
| Surface area > sq. km | 26,340 km² | [144th of 206] |
| tallest mountains > Mountain | Volcan Karisimbi | |

 |
|
| Compensation of employees > % of expense | 35.76 % | [22nd of 97] |
| Compensation of employees > current LCU | 14545000000 | |
| CPIA building human resources rating | 4 | [17th of 75] |
| Economic activity > Both sexes aged 10-14 | 41.35 | [7th of 89] |
| Economic activity > Both sexes aged 15-19 | 83.28 | [1st of 167] |
| Economic activity > Both sexes aged 20-24 | 91.51 | [2nd of 166] |
| Economic activity > Both sexes aged 25-29 | 93.09 | [9th of 167] |
| Economic activity > Both sexes aged 30-34 | 94.25 | [14th of 165] |
| Economic activity > Both sexes aged 35-39 | 94.24 | [20th of 166] |
| Economic activity > Both sexes aged 40-44 | 94.16 | [20th of 167] |
| Economic activity > Both sexes aged 45-49 | 93.22 | [17th of 163] |
| Economic activity > Both sexes aged 50-54 | 89.11 | [11th of 166] |
| Economic activity > Both sexes aged 55-59 | 83.55 | [15th of 166] |
| Economic activity > Both sexes aged 60-64 | 72.75 | [17th of 166] |
| Economic activity > Both sexes aged 65 plus | 49.24 | [24th of 165] |
| Economic activity > Men aged 10-14 | 37.64 | [15th of 92] |
| Economic activity > Men aged 15-19 | 85.07 | [1st of 164] |
| Economic activity > Men aged 20-24 | 96.24 | [1st of 166] |
| Economic activity > Men aged 25-29 | 98.05 | [4th of 165] |
| Economic activity > Men aged 30-34 | 98.45 | [12th of 165] |
| Economic activity > Men aged 35-39 | 98.25 | [27th of 164] |
| Economic activity > Men aged 40-44 | 98.2 | [19th of 163] |
| Economic activity > Men aged 45-49 | 97.71 | [20th of 167] |
| Economic activity > Men aged 50-54 | 96.51 | [18th of 165] |
| Economic activity > Men aged 55-59 | 94.33 | [19th of 167] |
| Economic activity > Men aged 60-64 | 88.13 | [25th of 165] |
| Economic activity > Men aged 65 plus | 68.39 | [28th of 162] |
| Economic activity > Women aged 10-14 | 45.02 | [3rd of 89] |
| Economic activity > Women aged 15-19 | 81.51 | [1st of 164] |
| Economic activity > Women aged 20-24 | 86.88 | [5th of 166] |
| Economic activity > Women aged 25-29 | 88.23 | [16th of 165] |
| Economic activity > Women aged 30-34 | 90.14 | [18th of 167] |
| Economic activity > Women aged 35-39 | 90.34 | [22nd of 165] |
| Economic activity > Women aged 40-44 | 90.27 | [24th of 165] |
| Economic activity > Women aged 50-54 | 82.24 | [21st of 166] |
| Economic activity > Women aged 55-59 | 73.85 | [17th of 167] |
| Economic activity > Women aged 60-64 | 59.28 | [19th of 165] |
| Economic activity > Women aged 65 plus | 34.77 | [19th of 167] |
| Economically active children, female | 30.3 % | [12th of 34] |
| Economically active children, male | 36.1 % | [12th of 34] |
| Economically active children, study and work | 72.51 % | [15th of 34] |
| Economically active children, study and work, female | 70.3 % | [17th of 34] |
| Economically active children, study and work, male | 74.52 % | [16th of 34] |
| Economically active children, total | 33.1 % | [13th of 34] |
| Economically active children, work only | 27.49 % | [20th of 34] |
| Economically active children, work only, female | 29.7 % | [18th of 33] |
| Economically active children, work only, male | 25.48 % | [19th of 34] |
| Female economic activity | 82.6% | [2nd of 156] |
| Female economic activity growth | -1% | [128th of 156] |
| Firing cost > weeks of wages | 26 weeks of wages | [114th of 164] |
| force participation rate, female > % of female population ages 15-64 | 82.01 % | [7th of 184] |
| force participation rate, male > % of male population ages 15-64 | 84.9 % | [53rd of 184] |
| force participation rate, total > % of total population ages 15-64 | 83.39 % | [12th of 184] |
| force with primary education > % of total | 54 % | [9th of 48] |
| force with secondary education > % of total | 3.1 % | [51st of 51] |
| force with tertiary education > % of total | 0.2 % | [52nd of 52] |
| force, female > % of total labor force | 51.17 % | [4th of 184] |
| force, total | 4,182,898 | [79th of 184] |
| Labor force > By occupation | agriculture 90% | |
| Minimum Age Convention, 1973 > Ratifications > Date | April 15, 1981 | |
| Minimum Age Convention, 1973 > Ratifications > Minimum age | 14 | [111st of 146] |
| Parental leave > Paid maternity leave | 12 weeks | |
| Parental leave > Paid paternity leave | Two days | |
| Regulation | 60 | [39th of 123] |
| Regulation > Employment Conditions | 94 | [2nd of 123] |
| Regulation > Firing | 32 | [72nd of 123] |
| Regulation > Hiring | 53 | [59th of 123] |
| Right to Organise and Collective Bargaining Convention > Ratifications > Date | August 11, 1988 | |
| Rigidity of employment index | 49 | [49th of 166] |
| skills > % of managers surveyed ranking this as a major business constraint | 2.75 % | [12th of 38] |
| Technicians in R&D > per million people | 6.25 per million people | [11th of 49] |
| Unemployment with secondary education, female > % of female unemployment | 24.9 % | [53rd of 71] |
| Unemployment with secondary education, male > % of male unemployment | 23 % | [51st of 71] |
| Unemployment with tertiary education > % of total unemployment | 5.9 % | [56th of 77] |
| Unemployment with tertiary education, female > % of female unemployment | 9.4 % | [43rd of 71] |
| Unemployment with tertiary education, male > % of male unemployment | 0.5 % | [64th of 71] |
| Unemployment, female > % of female labor force | 0.4 % | [89th of 95] |
| Unemployment, male > % of male labor force | 0.9 % | [89th of 95] |
| Unemployment, total > % of total labor force | 0.6 % | [95th of 101] |
| Unemployment, youth female > % of female labor force ages 15-24 | 0.5 % | [70th of 77] |
| Unemployment, youth male > % of male labor force ages 15-24 | 1 % | [69th of 77] |
| Unemployment, youth total > % of total labor force ages 15-24 | 0.7 % | [70th of 77] |
| Workers' remittances and compensation of employees, paid > US$ | 35,000,000 $ | [94th of 149] |
| Workers' remittances and compensation of employees, paid > US$ (per $ GDP) | 16.253 $ per $1,000 of GDP | [31st of 166] |
| Workers' remittances and compensation of employees, received > US$ | 21,000,000 $ | [127th of 156] |
| Workers' remittances and compensation of employees, received > US$ (per $ GDP) | 9.752 $ per $1,000 of GDP | [88th of 165] |
| Workers' remittances, receipts > BoP, current US$ | 8,630,000 BoP $ | [82nd of 115] |
| Workers' remittances, receipts > BoP, current US$ (per $ GDP) | 4.007 BoP $ per $1 million of | [61st of 142] |
SOURCES
World Development
Indicators database; Economic activity rate and economically active
population, by sex, thirteen age groups, 1950-2010 (ILO estimates and
projections) are data from the International Labour Union (ILO). Source details:
ILO, Economically Active Population, 1950-2010, fourth edition, diskette
database (Geneva, 1997). The latest set of estimates and projections covering
the period 1950-2010 (4th edition) was released by ILO in December 1996. These
data are updated every five-ten years by ILO and a new set of these data is in
preparation; calculated on the basis of data on the economically active
population and total population from ILO (International Labour Organization).
2002. Estimates and Projections of the Economically Active Population,
1950-2010, 4th ed., rev. 2. Database. Geneva; All
CIA World
Factbooks 18 December 2003 to 18 December 2008; Wikipedia:
Minimum Age
Convention, 1973 ; Wikipedia:
Parental leave ;
The World Bank Group The original methodology and data come from The
Regulation of Labor, by Juan Botero, Simeon Djankov, Rafael La Porta, Florencio
Lopez-de-Silanes, and Andrei Shleifer. When using the data, please also cite
this paper as a reference.;
The World Bank Group The original methodology and data come from The
Regulation of Labor, by Juan Botero, Simeon Djankov, Rafael La Porta, Florencio
Lopez-de-Silanes, and Andrei Shleifer. When using the data, please also cite
this paper as a reference; Wikipedia:
Right to Organise and Collective Bargaining Convention, 1949
ALTERNATIVE NAMES
Rwanda, Rwandese Republic, Republika
y'u Rwanda
People
| African countries by population density > area | 26,338 | [45th of 56] |
| African countries by population density > pop. dens. | 281 | [5th of 56] |
| African countries by population density > population | 7,398,074 | [29th of 56] |
| Age dependency ratio > dependents to working-age population | 0.85 | [29th of 185] |
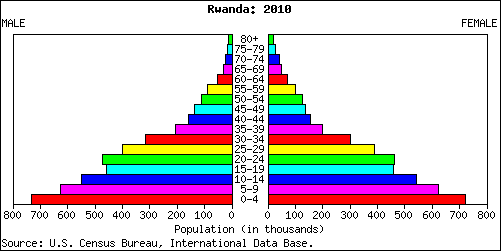
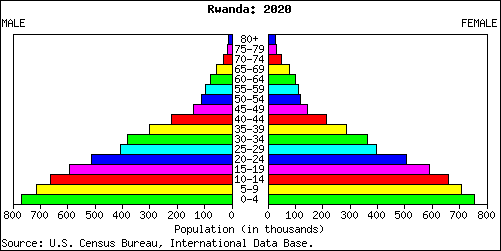
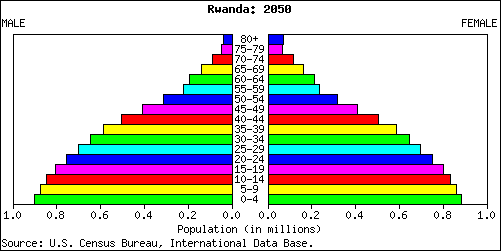
| Age structure > 0-14 years | 41.9 | [44th of 226] |
| Age structure > 0-14 years > Females | 2,124,588 | [70th of 225] |
| Age structure > 0-14 years > From total | 41.9% | [37th of 227] |
| Age structure > 0-14 years > Males | 2,143,479 | [70th of 225] |
| Age structure > 15-64 years | 55.5 | [180th of 226] |
| Age structure > 15-64 years > Females | 2,842,020 | [86th of 225] |
| Age structure > 15-64 years > From total | 55.7% | [180th of 227] |
| Age structure > 15-64 years > Males | 2,826,557 | [83rd of 225] |
| Age structure > 65 years and over > Females | 149,698 | [118th of 225] |
| Age structure > 65 years and over > From total | 2.4% | [210th of 227] |
| Age structure > 65 years and over > Males | 99,721 | [125th of 225] |
| Child Protection > Birth registration, % of rural | 66 | [25th of 52] |
| Child Protection > Birth registration, % of total | 65 | [30th of 56] |
| Child Protection > Birth registration, % of urban | 61 | [39th of 52] |
| Child Protection > Child labour 5-14 years, % of female | 30 | [12th of 46] |
| Child Protection > Child labour 5-14 years, % of male | 31 | [14th of 46] |
| Child Protection > Child labour 5-14 years, % of poorest 20% | 30 | [25th of 43] |
| Child Protection > Child labour 5-14 years, % of richest 20% | 18 | [14th of 43] |
| Child Protection > Child labour 5-14 years, % of rural | 33 | [19th of 42] |
| Child Protection > Child labour 5-14 years, % of total | 31 | [13th of 46] |
| Child Protection > Child labour 5-14 years, % of urban | 17 | [20th of 42] |
| CPIA social protection rating | 3.5 | [13th of 75] |
| Female population > Age 10-14 | 477,828 | [80th of 224] |
| Female population > Age 10-14 > % of the total | 5.53 | [77th of 224] |
| Female population > Age 15-19 | 492,783 | [77th of 224] |
| Female population > Age 15-19 > % of the total | 5.7 | [27th of 224] |
| Female population > Age 20-24 | 449,692 | [75th of 224] |
| Female population > Age 20-24 > % of the total | 5.2 | [20th of 224] |
| Female population > Age 25-29 | 380,921 | [80th of 224] |
| Female population > Age 25-29 > % of the total | 4.4 | [26th of 224] |
| Female population > Age 30-34 | 275,189 | [91st of 224] |
| Female population > Age 30-34 > % of the total | 3.18 | [157th of 224] |
| Female population > Age 35-39 | 208,734 | [97th of 224] |
| Female population > Age 35-39 > % of the total | 2.41 | [198th of 224] |
| Female population > Age 40-44 | 178,312 | [101st of 224] |
| Female population > Age 40-44 > % of the total | 2.06 | [192nd of 224] |
| Female population > Age 45-49 | 153,417 | [104th of 224] |
| Female population > Age 45-49 > % of the total | 1.77 | [187th of 224] |
| Female population > Age 50-54 | 127,480 | [103rd of 224] |
| Female population > Age 50-54 > % of the total | 1.47 | [183rd of 224] |
| Female population > Age 55-59 | 89,084 | [110th of 224] |
| Female population > Age 55-59 > % of the total | 1.03 | [206th of 224] |
| Female population > Age 60-64 | 61,855 | [117th of 224] |
| Female population > Age 60-64 > % of the total | 0.72 | [212nd of 224] |
| Female population > Age 65-69 | 50,961 | [118th of 224] |
| Female population > Age 65-69 > % of the total | 0.59 | [206th of 224] |
| Female population > Age 70-74 | 38,803 | [118th of 224] |
| Female population > Age 70-74 > % of the total | 0.45 | [194th of 224] |
| Female population > Age 75-79 | 23,651 | [122nd of 224] |
| Female population > Age 75-79 > % of the total | 0.27 | [187th of 224] |
| Female population > Age 80-84 | 17,131 | [122nd of 224] |
| Female population > Age 80-84 > % of the total | 0.2 | [181st of 224] |
| Gender development | 0.398 | [131st of 141] |
| Male population > Age 10-14 | 478,431 | [82nd of 224] |
| Male population > Age 10-14 > % of the total | 5.53 | [83rd of 224] |
| Male population > Age 15-19 | 493,766 | [78th of 224] |
| Male population > Age 15-19 > % of the total | 5.71 | [39th of 224] |
| Male population > Age 20-24 | 447,690 | [75th of 224] |
| Male population > Age 20-24 > % of the total | 5.18 | [29th of 224] |
| Male population > Age 25-29 | 381,265 | [80th of 224] |
| Male population > Age 25-29 > % of the total | 4.41 | [45th of 224] |
| Male population > Age 30-34 | 278,810 | [89th of 224] |
| Male population > Age 30-34 > % of the total | 3.22 | [176th of 224] |
| Male population > Age 35-39 | 218,942 | [93rd of 224] |
| Male population > Age 35-39 > % of the total | 2.53 | [198th of 224] |
| Male population > Age 40-44 | 190,072 | [96th of 224] |
| Male population > Age 40-44 > % of the total | 2.2 | [178th of 224] |
| Male population > Age 45-49 | 146,755 | [103rd of 224] |
| Male population > Age 45-49 > % of the total | 1.7 | [187th of 224] |
| Male population > Age 50-54 | 116,061 | [103rd of 224] |
| Male population > Age 50-54 > % of the total | 1.34 | [181st of 224] |
| Male population > Age 55-59 | 76,173 | [109th of 224] |
| Male population > Age 55-59 > % of the total | 0.88 | [199th of 224] |
| Male population > Age 60-64 | 43,244 | [127th of 224] |
| Male population > Age 60-64 > % of the total | 0.5 | [221st of 224] |
| Male population > Age 65-69 | 34,238 | [128th of 224] |
| Male population > Age 65-69 > % of the total | 0.4 | [221st of 224] |
| Male population > Age 70-74 | 26,499 | [125th of 224] |
| Male population > Age 70-74 > % of the total | 0.31 | [212nd of 224] |
| Male population > Age 75-79 | 15,712 | [126th of 224] |
| Male population > Age 75-79 > % of the total | 0.18 | [217th of 224] |
| Male population > Age 80-84 | 10,876 | [122nd of 224] |
| Male population > Age 80-84 > % of the total | 0.13 | [192nd of 224] |
|
People > Note Rwanda is the most densely populated country in Africa |
||
| Percentage living in rural areas. | 82% | [11th of 193] |
| Percentage living in urban areas | 18% | [191st of 199] |
| Population > CIA Factbook | 10,186,063 | [79th of 240] |
| Population ages 0-14 > % of total | 43.49 % | [24th of 185] |
| Population ages 15-64 > % of total | 54.05 % | [155th of 185] |
| Population ages 65 and above > % of total | 2.46 % | [172nd of 185] |
| Population growth > annual % | 1.73 annual % | [73rd of 195] |
| Population in largest city | 778,658 | [118th of 118] |
| Population in the largest city > % of urban population | 44.64 % | [22nd of 118] |
| Population, female > % of total | 51.5 % | [34th of 190] |
| Projected population growth | 21.78% | [92nd of 141] |
| Rights of the Child Convention > Ratification Dates | 24 Jan 1991 | |
| Rights of the Child Convention > Signatories | 26 Jan 1990 | |
| Rural population | 7,293,416 | [60th of 193] |
| Rural population growth > annual % | 0.38 annual % | [95th of 193] |
| Sex ratio > 15-64 years | 0.99 | [138th of 223] |
| Sex ratio > sex ratios > 15–65 | 0.99 | [130th of 215] |
| Sex ratio > sex ratios > at birth | 1.03 | [166th of 215] |
| Sex ratio > sex ratios > over 65 | 0.67 | [179th of 215] |
| Sex ratio > sex ratios > total | 0.99 | [112nd of 215] |
| Sex ratio > sex ratios > under 15 | 1.01 | [194th of 215] |
| Total Population | 8,648,248 | [88th of 227] |
| Total population > Age 10-14 | 956,259 | [81st of 224] |
| Total population > Age 10-14 > % of the total | 11.06 | [81st of 224] |
| Total population > Age 15-19 | 986,549 | [78th of 224] |
| Total population > Age 15-19 > % of the total | 11.41 | [32nd of 224] |
| Total population > Age 20-24 | 897,382 | [75th of 224] |
| Total population > Age 20-24 > % of the total | 10.38 | [23rd of 224] |
| Total population > Age 25-29 | 762,186 | [80th of 224] |
| Total population > Age 25-29 > % of the total | 8.81 | [36th of 224] |
| Total population > Age 30-34 | 553,999 | [89th of 224] |
| Total population > Age 30-34 > % of the total | 6.41 | [167th of 224] |
| Total population > Age 35-39 | 427,676 | [96th of 224] |
| Total population > Age 35-39 > % of the total | 4.95 | [201st of 224] |
| Total population > Age 40-44 | 368,384 | [96th of 224] |
| Total population > Age 40-44 > % of the total | 4.26 | [191st of 224] |
| Total population > Age 45-49 | 300,172 | [102nd of 224] |
| Total population > Age 45-49 > % of the total | 3.47 | [189th of 224] |
| Total population > Age 50-54 | 243,541 | [102nd of 224] |
| Total population > Age 50-54 > % of the total | 2.82 | [179th of 224] |
| Total population > Age 55-59 | 165,257 | [110th of 224] |
| Total population > Age 55-59 > % of the total | 1.91 | [207th of 224] |
| Total population > Age 60-64 | 105,099 | [121st of 224] |
| Total population > Age 60-64 > % of the total | 1.22 | [218th of 224] |
| Total population > Age 65-69 | 85,199 | [123rd of 224] |
| Total population > Age 65-69 > % of the total | 0.99 | [215th of 224] |
| Total population > Age 70-74 | 65,302 | [122nd of 224] |
| Total population > Age 70-74 > % of the total | 0.76 | [203rd of 224] |
| Total population > Age 75-79 | 39,363 | [126th of 224] |
| Total population > Age 75-79 > % of the total | 0.46 | [196th of 224] |
| Total population > Age 80-84 | 28,007 | [123rd of 224] |
| Total population > Age 80-84 > % of the total | 0.32 | [191st of 224] |
| Total Population > Female | 4,350,147 | [88th of 227] |
| Total Population > Male | 4,298,101 | [88th of 227] |
| Urban population | 1,744,274 | [128th of 195] |
| Urban population growth > annual % | 7.6 annual % | [1st of 195] |
| Urbanization | 6 | [205th of 204] |
| Urbanization in 1975 | 4% | [163rd of 164] |
| Urbanization in 2015 | 8.9% | [165th of 164] |
| Women > Adult literacy rate females as a % of males | 82 | [92nd of 144] |
| Women > Antenatal care coverage % | 92 | [50th of 133] |
| Women > Contraceptive prevalence % | 13 | [152nd of 170] |
| Women > Life expectancy females as a % of males | 103 | [153rd of 173] |
| Women > Maternal mortality ratio > reported | 1,100 | [5th of 154] |
| Women > Maternal mortality ratio adjusted | 1,400 | [6th of 166] |
| Women > Skilled attendant at delivery % | 31 | [159th of 172] |
SOURCES
Wikipedia:
List of African countries by population density ;
World Development
Indicators database;
CIA World Factbook, 28 July 2005; All
CIA World
Factbooks 18 December 2003 to 18 December 2008;
UNICEF;
U.S. Census Bureau,
Population Division, International Programs Center ; Human Development
Reports, United Nations 2002; Population Division of the United Nations
Secretariat, World Urbanization Prospects: The 2003 Revision, Data Tables and
Highlights. Estimates and projections of urban and rural populations are made by
the Population Division of the United Nations Secretariat and published every
two years. These estimates and projections are based on national census or
survey data that have been evaluated and, whenever necessary, adjusted for
deficiencies and inconsistencies; Population Reference Bureau, 2001 World
Population Data Sheet, Washington, DC: PRB, 2001. via ciesin.org; The Office of
the High Commissioner for Human Rights; The Office of the High Commissioner for
Human RIghts; Wikipedia: Sex
ratio ; U.S. Census
Bureau, Population Division, International Programs Center Spanish Statistical Institute; Population
Division of the United Nations Secretariat, World Urbanization Prospects: The
2001 Revision, Data Tables and Highlights (ESA/P/WP.173, 20 March 2002); UN
(United Nations). 2002. World Urbanization Prospects: The 2001 Revision.
Department of Economic and Social Affairs, Population Division. New York
ALTERNATIVE NAMES
Rwanda, Rwandese Republic, Republika
y'u Rwanda
Mortality
| Death rate, crude > per 1,000 people | 18.05 per 1,000 people | [21st of 195] |
| rate, adult, female > per 1,000 female adults | 455.38 per 1,000 female adults | [22nd of 185] |
| rate, adult, male > per 1,000 male adults | 505.39 per 1,000 male adults | [16th of 185] |
| rate, infant > per 1,000 live births | 118 per 1,000 live births | [12th of 187] |
| rate, under-5 > per 1,000 | 203 per 1,000 | [10th of 187] |
ALTERNATIVE NAMES
Rwanda, Rwandese Republic, Republika
y'u Rwanda
Immigration
| immigrant population > Immigrants as percentage of state population | 1.339 | [139th of 195] |
| immigrant population > Number of immigrants | 121,000 | [115th of 195] |
| immigrant population > Percentage of total number of immigrants in the world | >0.1% | |
| Net migration rate | 2.29 migrant(s)/1,000 populati | [40th of 225] |
| Refugees | 892,110 | [5th of 110] |
| Refugees > Convention on refugees | 3 Jan 1980 a | |
| Refugees > Outflow | 118,000 | [11th of 76] |
| Refugees > US acceptance rates | 18.5 | [40th of 49] |
| Refugees > US applications | 151 | [21st of 64] |
| Refugees > US applications approved | 28 | [24th of 53] |
| Refugees > US applications denied | 18 | [24th of 41] |
| Refugees > US applications otherwise closed | 54 | [16th of 39] |
| Refugees and internally displaced persons > IDPs | 4,158 | [29th of 40] |
|
Refugees and internally displaced persons > Refugees (country of
origin) 46,272 (Democratic Republic of the Congo); 4,400 (Burundi) |
||
| US visa lottery winners | 87 US visa lottery winners | [79th of 178] |


| Other articles in this category |
|---|
| Rwanda at a glance |
| Geography |
| History |
| Culture |
| Economy |
| Politics |
| Military |