1) Natural geography
|
Area > Comparative to US places
|
||
|
Capital city with population |
Lilongwe - 260,000 |
|
|
capitals and largest cities > Countries > Cities larger than the
capital
|
||
|
Forested Land |
27.2% |
[102nd of 193] |
|
Geographic coordinates |
13 30 S, 34 00 E |
|
|
Largest city
|
||
|
Largest city population |
437,000 |
[121st of 174] |
|
Largest city with population |
Lilongwe - 260,000 |
|
|
northernmost point > Latitude |
09°22'S |
|
|
Population density |
106.3 people per sqkm |
[95th of 256] |
|
Population density > people per sq. km |
136.95 people/m² |
[64th of 204] |
|
Precipitation |
922 mm |
[37th of 95] |
|
Rural population density > rural population per sq. km of arable land |
421.22 people/km² of arable lan |
[69th of 188] |
|
Surface area > sq. km |
118,480 km² |
[98th of 206] |
|
tallest mountains > Mountain |
Sapitwa (Mount Mlanje) |
|
SOURCES All
CIA World
Factbooks
18 December 2003 to 18 December 2008; United Nations
World
Statistics Pocketbook
and
Statistical
Yearbook
, City Population
, CIA World
Factbook, World Gazetteer , Official government websites.; Wikipedia
List of capitals and largest cities by country
; FAO; United Nations
World
Statistics Pocketbook
and
Statistical
Yearbook ; Wikipedia
List of countries by northernmost point
;
Heal The World
Foundation.
; World
Development Indicators database ; Wikipedia List
of tallest mountains by country
ALTERNATIVE NAMES Malawi, Republic
of Malawi
Environment
|
Adjusted savings net forest depletion > % of GNI |
0.92 % of GNI |
[20th of 57] |
|
Areas under protection |
9 |
[119th of 146] |
|
Carbon efficiency |
0.36 CO2 emissions/$ GDP |
[121st of 141] |
|
CO2 Emissions |
782.3 |
[140th of 178] |
|
Ecological footprint |
0.87 |
[126th of 141] |
|
Endangered species protection |
77.8% |
[57th of 141] |
|
Forest area > % of land area |
36.16 % of land area |
[72nd of 195] |
|
Forest area > sq. km |
34,020 km² |
[84th of 195] |
|
Known mammal species |
195 |
[40th of 145] |
|
Marine fish catch |
0 tons |
[133rd of 141] |
|
NOx emissions per populated area |
0.16 thousand metric tons/squ |
[105th of 141] |
|
Pollution > Carbon dioxide 1999 |
210 |
[148th of 199] |
|
Protected area |
11.3 |
[34th of 147] |
|
SO2 emissions per populated area |
50 thousand metric tons/squ |
[138th of 141] |
|
Threatened species |
24 |
[83rd of 158] |
|
Threatened species > Mammal |
7 |
[111st of 160] |
|
Water > Availability |
1.55 thousand cubic metres |
[94th of 141] |
|
Water > Dissolved oxygen concentration |
8.35 mls/litre |
[54th of 141] |
|
Water pollution, wood industry > % of total BOD emissions |
1.68 % |
[53rd of 114] |
|
Wildness |
16.1% |
[52nd of 141] |
SOURCES World Development
Indicators database
; World Resources Institute
;
Carbon Dioxide Information
Analysis Center
; World Resources Institute. 2003. Carbon Emissions from
energy use and cement manufacturing, 1850 to 2000. Available on-line through the
Climate Analysis Indicators Tool
(CAIT) at
Washington, DC World Resources Institute; World Wide Fund for Nature (WWF),
Living Planet Report 2000, Gland, Switzerland 2000, and Redefining
Progress
.;
Convention on International Trade in Endangered Species of Wild Fauna and Flora
,
Report on National Reports Required Under Article VIII, Paragraph 7(a), of the
Convention, Eleventh Meeting of the Conference of the Parties, Gigiri, Kenya,
April 2000; FAOSTAT on-line database ; Intergovernmental Panel on Climate Change Special Report on
Emissions Scenarios
, Data Version 1.1, B1Illustrative Marker Scenario with
model IMAGE; Gregg Marland, Tom Boden, and Bob Andres, University of North
Dakota, via net
publication
;
Jacaranda Atlas
; United Nations
World
Statistics Pocketbook
and
Statistical
Yearbook
; Center for Environmental Systems Research, University of Kassel,
WaterGAP 2.1B, 2001 via ciesin.org; United Nations Environment Programme (UNEP),
Global Environmental Monitoring System
/Water
Quality Monitoring System, with data for an additional 29 countries from
Prescott-Allen,R. The Well being of Nations, Washington, DC Island Press, 2001;
Wild Areas Project (WAP), joint Wildlife Conservation Society (WCS) and CIESIN
project to map the lastwild places on the earth's surface. via ciesin.org
ALTERNATIVE NAMES Malawi, Republic
of Malawi
2) Human geography
Age distribution
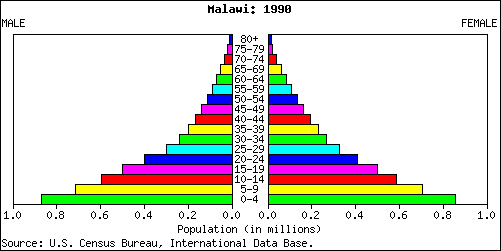
Malawi Population Pyramid for 1990
Age and sex distribution for the year 1990
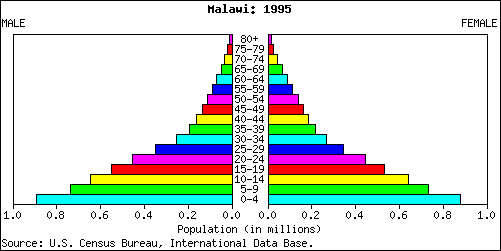
Age and sex distribution for the year 1995
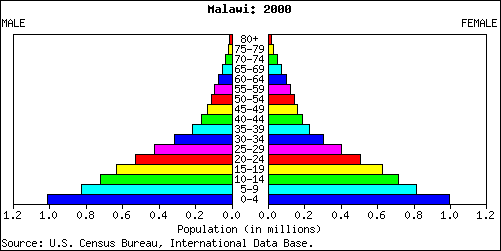
Age and sex distribution for the year 2000
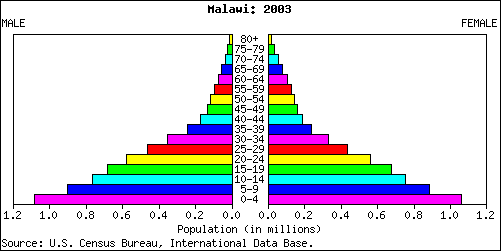
Age and sex distribution for the year 2003
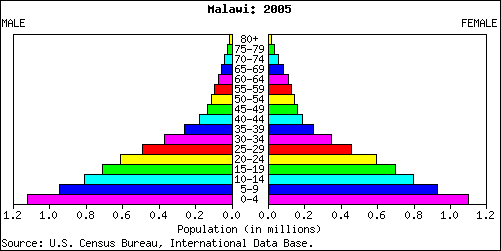
Age and sex distribution for the year 2005
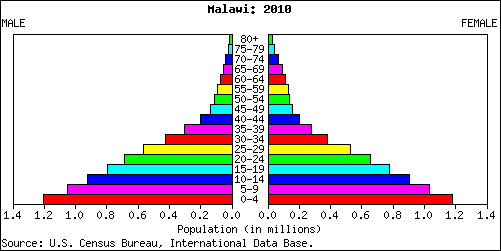
Age and sex distribution for the year 2010
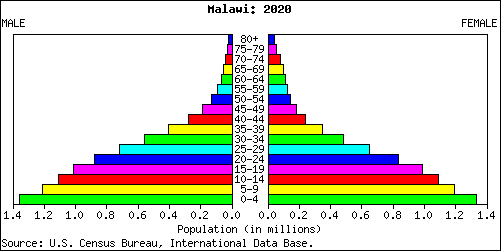
Predicted age and sex distribution for the year 2020
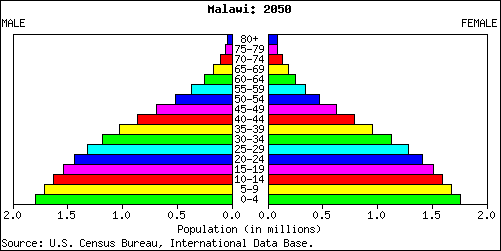
Predicted age and sex distribution for the year 2050
Labor
|
Economic activity > Both sexes aged 10-14 |
31.49 |
[19th of 89] |
|
Economic activity > Men aged 65 plus |
83.47 |
[1st of 162] |
|
Female economic activity |
77.9% |
[8th of 156] |
|
Female economic activity growth |
-2% |
[138th of 156] |
|
Firing cost > weeks of wages |
84.3 weeks of wages |
[36th of 164] |
|
force, female > % of total labor force |
49.82 % |
[6th of 184] |
|
force, total |
5,929,696 |
[63rd of 184] |
|
Labor force > By occupation |
agriculture 90% |
|
|
Regulation |
52 |
[70th of 123] |
|
Regulation > Employment Conditions |
68 |
[71st of 123] |
|
Regulation > Firing |
54 |
[23rd of 123] |
|
Rigidity of employment index |
21 |
[134th of 166] |
|
Unemployment, female > % of female labor force |
0.6 % |
[86th of 95] |
|
Unemployment, male > % of male labor force |
1.2 % |
[86th of 95] |
|
Unemployment, total > % of total labor force |
0.9 % |
[90th of 101] |
|
Unemployment, youth female > % of female labor force ages 15-24 |
0.3 % |
[35th of 77] |
|
Unemployment, youth male > % of male labor force ages 15-24 |
1.6 % |
[34th of 77] |
|
Unemployment, youth total > % of total labor force ages 15-24 |
0.8 % |
[35th of 77] |
|
Workers' remittances and compensation of employees, paid > US$ |
1,000,000 $ |
[144th of 149] |
|
Workers' remittances, receipts > BoP, current US$ |
843,693.6 BoP $ |
[110th of 115] |
SOURCES Economic activity rate and
economically active population, by sex, thirteen age groups, 1950-2010 (ILO
estimates and projections) are data from the International Labour Union (ILO).
Source details ILO, Economically Active Population, 1950-2010, fourth edition,
diskette database (Geneva, 1997). The latest set of estimates and projections
covering the period 1950-2010 (4th edition) was released by ILO in December
1996. These data are updated every five-ten years by ILO and a new set of these
data is in preparation; calculated on the basis of data on the economically
active population and total population from ILO (International Labour
Organization). 2002. Estimates and Projections of the Economically Active
Population, 1950-2010, 4th ed., rev. 2. Database. Geneva; World Development
Indicators database
; All
CIA World
Factbooks
18 December 2003 to 18 December 2008;
The World Bank Group
The original methodology and data come from The
Regulation of Labor, by Juan Botero, Simeon Djankov, Rafael La Porta, Florencio
Lopez-de-Silanes, and Andrei Shleifer. When using the data, please also cite
this paper as a reference.;
The World Bank Group
The original methodology and data come from The
Regulation of Labor, by Juan Botero, Simeon Djankov, Rafael La Porta, Florencio
Lopez-de-Silanes, and Andrei Shleifer. When using the data, please also cite
this paper as a reference
ALTERNATIVE NAMES Malawi, Republic
of Malawi
People
|
Age dependency ratio > dependents to working-age population |
1.01 |
[6th of 185] |
|
Age structure > 0-14 years |
46.9 |
[8th of 226] |
|
Age structure > 15-64 years |
50.4 |
[221st of 226] |
|
Chinese population |
50 |
[115th of 127] |
|
Gender development |
0.389 |
[133rd of 141] |
|
Percentage living in rural areas. |
84% |
[8th of 193] |
|
Percentage living in urban areas |
16% |
[194th of 199] |
|
Population > CIA Factbook |
13,931,831 |
[64th of 240] |
|
Population ages 0-14 > % of total |
47.34 % |
[5th of 185] |
|
Projected population growth |
110.28% |
[36th of 141] |
|
Rural population |
10,667,900 |
[45th of 193] |
|
Sex ratio > 15-64 years |
0.99 |
[133rd of 223] |
|
Total Population |
13,013,926 |
[65th of 227] |
|
Total Population > Female |
6,539,878 |
[65th of 227] |
|
Total Population > Male |
6,474,048 |
[65th of 227] |
|
Urban population |
2,216,037 |
[121st of 195] |
|
Urbanization |
15 |
[199th of 204] |
|
Urbanization in 2015 |
21.3% |
[159th of 164] |
|
Women > Adult literacy rate females as a % of males |
62 |
[124th of 144] |
|
Women > Life expectancy females as a % of males |
100 |
[171st of 173] |
SOURCES World Development
Indicators database
;
CIA World Factbook
, 28 July 2005;
University Libraries
, Ohio University; Human Development Reports, United
Nations 2002; Population Division of the United Nations Secretariat, World
Urbanization Prospects The 2003 Revision, Data Tables and Highlights. Estimates
and projections of urban and rural populations are made by the Population
Division of the United Nations Secretariat and published every two years. These
estimates and projections are based on national census or survey data that have
been evaluated and, whenever necessary, adjusted for deficiencies and
inconsistencies; All CIA World
Factbooks
18 December 2003 to 18 December 2008; Population Reference Bureau,
2001 World Population Data Sheet, Washington, DC PRB, 2001. via ciesin.org; U.S. Census Bureau,
Population Division, International Programs Center Spanish Statistical Institute
; Population
Division of the United Nations Secretariat, World Urbanization Prospects The
2001 Revision, Data Tables and Highlights (ESA/P/WP.173, 20 March 2002); UN
(United Nations). 2002. World Urbanization Prospects The 2001 Revision.
Department of Economic and Social Affairs, Population Division. New York; UNICEF
ALTERNATIVE NAMES Malawi, Republic
of Malawi
Mortality
|
Death rate, crude > per 1,000 people |
20.63 per 1,000 people |
[9th of 195] |
|
rate, adult, female > per 1,000 female adults |
652.9 per 1,000 female adults |
[7th of 185] |
|
rate, adult, male > per 1,000 male adults |
634.69 per 1,000 male adults |
[8th of 185] |
|
rate, infant > per 1,000 live births |
78.9 per 1,000 live births |
[35th of 187] |
|
rate, under-5 > per 1,000 |
125.3 per 1,000 |
[30th of 187] |
SOURCES World Development
Indicators database
ALTERNATIVE NAMES Malawi, Republic
of Malawi
Immigration
|
immigrant population > Immigrants as percentage of state population |
2.165 |
[116th of 195] |
|
immigrant population > Number of immigrants |
279,000 |
[83rd of 195] |
|
immigrant population > Percentage of total number of immigrants in the world |
>0.5% |
|
|
Net migration rate |
0 migrant(s)/1,000 populati |
[90th of 225] |
|
Refugees |
1,010 |
[86th of 110] |
|
Refugees > Convention on refugees |
10 Dec 1987 a |
|
|
US visa lottery winners |
32 US visa lottery winners |
[105th of 178] |
SOURCES Wikipedia
List of countries by immigrant population
; All
CIA World
Factbooks
18 December 2003 to 18 December 2008; United Nations
World
Statistics Pocketbook
and
Statistical
Yearbook
; United Nations Treaty Collection; US Department of State Bureau
of Consular Affairs
ALTERNATIVE NAMES Malawi, Republic
of Malawi


| Other articles in this category |
|---|
| Malawi at a glance |
| Geography |
| History |
| Culture |
| Economy |
| Politics |
| Military |