1) Natural geography
|
Area > Comparative to US places |
||
|
Capital city with population |
Praia - 61,797 |
|
|
Forested Land |
21.1% |
[116th of 193] |
|
Geographic coordinates |
16 00 N, 24 00 W |
|
|
Largest city |
Praia |
|
|
Largest city population |
68,000 |
[148th of 174] |
|
Largest city with population |
Praia - 61,797 |
|
|
northernmost point > Latitude |
17°12'N |
|
|
Population density |
100.68 people per sqkm |
[97th of 256] |
|
Population density > people per sq. km |
125.76 people/m² |
[71st of 204] |
|
Rural population density > rural population per sq. km of arable land |
465.38 people/km² of arable lan |
[59th of 188] |
|
Surface area > sq. km |
4,030 km² |
[166th of 206] |
|
tallest
mountains > Mountain |
||
|
Adjusted savings: carbon dioxide damage > % of GNI |
0.12 % of GNI |
[156th of 179] |
|
CO2 Emissions |
211.8 |
[163rd of 178] |
|
CO2 emissions > kg per 2000 PPP $ of GDP |
0.06 kg/PPP$ |
[155th of 170] |
|
CO2 emissions > kt |
142.86 kt |
[187th of 195] |
|
CPIA policy and institutions for environmental sustainability rating |
4 |
[6th of 75] |
|
Forest area > % of land area |
20.84 % of land area |
[124th of 195] |
|
Forest area > sq. km |
840 km² |
[160th of 195] |
|
Freshwater withdrawal |
0.02 |
[124th of 124] |
|
Freshwater withdrawal > Agricultural |
91% |
[30th of 124] |
|
Freshwater withdrawal > Domestic |
7% |
[92nd of 124] |
|
Freshwater withdrawal > Industrial |
2% |
[96th of 124] |
|
Groundwater withdrawals |
0 |
[95th of 188] |
|
Organic water pollutant (BOD) emissions > kg per day |
95.93 kg/day |
[111st of 115] |
|
Organic water pollutant (BOD) emissions > kg per day per worker |
0.21 kg per day per worker |
[37th of 115] |
|
Pollution > Carbon dioxide 1999 |
38 |
[181st of 199] |
|
Red Kite > Populations and trends > Pairs |
1? |
|
|
Red Kite > Populations and trends > Trend |
– |
|
|
Red Kite > Populations and trends > Year |
2000 |
|
|
Threatened species |
8 |
[138th of 158] |
|
Threatened species > Mammal |
0 |
[162nd of 160] |
|
Water pollution, chemical industry > % of total BOD emissions |
10.23 % |
[21st of 114] |
|
Water pollution, clay and glass industry > % of total BOD emissions |
0.39 % |
[12th of 112] |
|
Water pollution, food industry > % of total BOD emissions |
22.25 % |
[106th of 114] |
|
Water pollution, paper and pulp industry > % of total BOD emissions |
60.04 % |
[2nd of 111] |
|
Water pollution, textile industry > % of total BOD emissions |
9.31 % |
[74th of 114] |
Age and sex distribution for the year
1990:
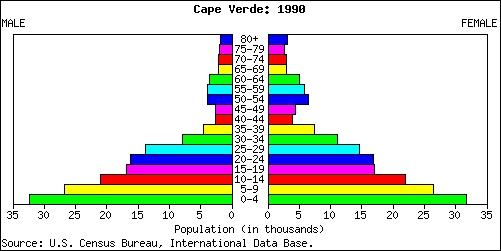
Age and sex distribution for the year
1995:
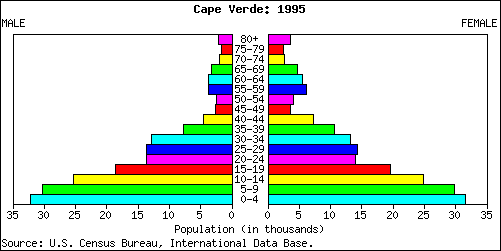
Age and sex distribution for the year
2000:
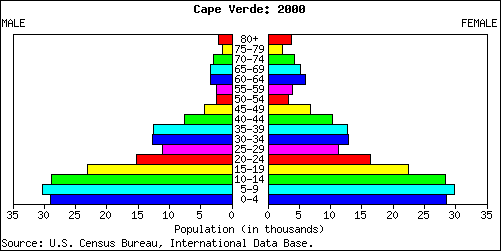
Age and sex distribution for the year
2003:
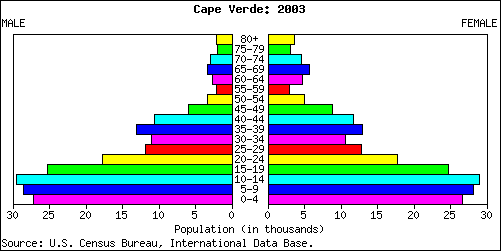
Age and sex distribution for the year
2005:
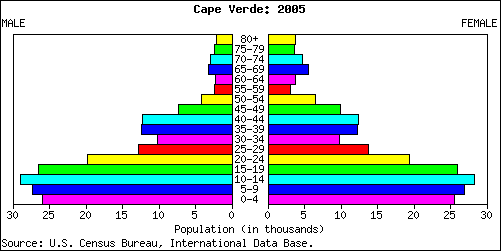
Age and sex distribution for the year
2010:
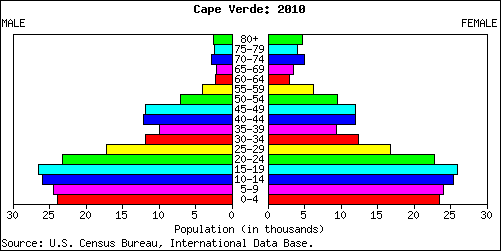
Predicted age and sex distribution for
the year 2020:
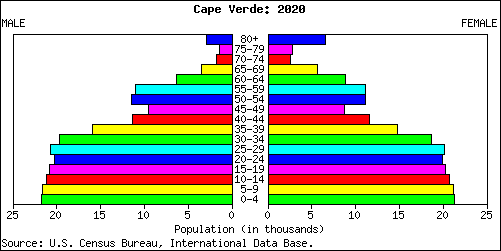
Predicted age and sex distribution for
the year 2050:
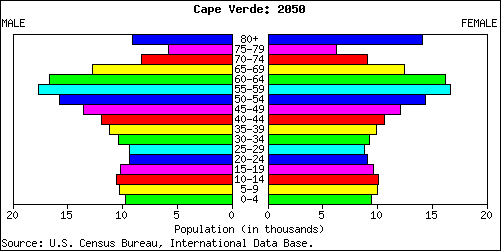
US Census Bureau July 17, 2003
Labor
|
CPIA building human resources rating |
4 |
[14th of 75] |
|
Economic activity > Both sexes aged 10-14 |
13.55 |
[56th of 89] |
|
Economic activity > Both sexes aged 15-19 |
54.18 |
[39th of 167] |
|
Economic activity > Both sexes aged 20-24 |
72.67 |
[86th of 166] |
|
Economic activity > Both sexes aged 25-29 |
76.08 |
[121st of 167] |
|
Economic activity > Both sexes aged 30-34 |
76.57 |
[124th of 165] |
|
Economic activity > Both sexes aged 35-39 |
75.49 |
[129th of 166] |
|
Economic activity > Both sexes aged 40-44 |
66.41 |
[157th of 167] |
|
Economic activity > Both sexes aged 45-49 |
59.76 |
[157th of 163] |
|
Economic activity > Both sexes aged 50-54 |
56.22 |
[159th of 166] |
|
Economic activity > Both sexes aged 55-59 |
49.78 |
[140th of 166] |
|
Economic activity > Both sexes aged 60-64 |
46.47 |
[86th of 166] |
|
Economic activity > Both sexes aged 65 plus |
30.1 |
[69th of 165] |
|
Economic activity > Men aged 10-14 |
16.92 |
[53rd of 92] |
|
Economic activity > Men aged 15-19 |
66.85 |
[15th of 164] |
|
Economic activity > Men aged 20-24 |
92.1 |
[8th of 166] |
|
Economic activity > Men aged 25-29 |
97.45 |
[12th of 165] |
|
Economic activity > Men aged 30-34 |
98.35 |
[16th of 165] |
|
Economic activity > Men aged 35-39 |
97.52 |
[87th of 164] |
|
Economic activity > Men aged 40-44 |
97.21 |
[68th of 163] |
|
Economic activity > Men aged 45-49 |
97.11 |
[46th of 167] |
|
Economic activity > Men aged 50-54 |
94.65 |
[55th of 165] |
|
Economic activity > Men aged 55-59 |
92.45 |
[40th of 167] |
|
Economic activity > Men aged 60-64 |
86.67 |
[36th of 165] |
|
Economic activity > Men aged 65 plus |
58.06 |
[42nd of 162] |
|
Economic activity > Women aged 10-14 |
10.1 |
[58th of 89] |
|
Economic activity > Women aged 15-19 |
41.21 |
[52nd of 164] |
|
Economic activity > Women aged 20-24 |
54.24 |
[117th of 166] |
|
Economic activity > Women aged 25-29 |
55.43 |
[121st of 165] |
|
Economic activity > Women aged 30-34 |
56.34 |
[119th of 167] |
|
Economic activity > Women aged 35-39 |
56.29 |
[123rd of 165] |
|
Economic activity > Women aged 40-44 |
48.7 |
[131st of 165] |
|
Economic activity > Women aged 45-49 |
44.74 |
[125th of 161] |
|
Economic activity > Women aged 50-54 |
37.96 |
[125th of 166] |
|
Economic activity > Women aged 55-59 |
31.1 |
[109th of 167] |
|
Economic activity > Women aged 60-64 |
26.61 |
[82nd of 165] |
|
Economic activity > Women aged 65 plus |
12.15 |
[77th of 167] |
|
Female economic activity |
46.1% |
[104th of 156] |
|
Female economic activity growth |
8% |
[45th of 156] |
|
Firing cost > weeks of wages |
91 weeks of wages |
[25th of 164] |
|
force participation rate, female > % of female population ages 15-64 |
36.59 % |
[164th of 184] |
|
force participation rate, male > % of male population ages 15-64 |
78.04 % |
[127th of 184] |
|
force participation rate, total > % of total population ages 15-64 |
56.26 % |
[170th of 184] |
|
force, female > % of total labor force |
33.83 % |
[154th of 184] |
|
force, total |
164,556.1 |
[165th of 184] |
|
regulations > % of managers surveyed ranking this as a major business constraint |
1.02 % |
[14th of 39] |
|
Right to Organise and Collective Bargaining Convention > Ratifications > Date |
April 3, 1979 |
|
|
Rigidity of employment index |
44 |
[63rd of 166] |
|
skills > % of managers surveyed ranking this as a major business constraint |
4.08 % |
[8th of 38] |
|
Technicians in R&D > per million people |
31.75 per million people |
[41st of 49] |
|
Workers' remittances and compensation of employees, paid > US$ |
5,000,000 $ |
[133rd of 149] |
|
Workers' remittances and compensation of employees, paid > US$ (per $ GDP) |
5.086 $ per $1,000 of GDP |
[63rd of 166] |
|
Workers' remittances and compensation of employees, received > US$ |
137,000,000 $ |
[105th of 156] |
|
Workers' remittances and compensation of employees, received > US$ (per $ GDP) |
139.356 $ per $1,000 of GDP |
[17th of 165] |
|
Workers' remittances, receipts > BoP, current US$ |
136,503,600 BoP $ |
[62nd of 115] |
|
Workers' remittances, receipts > BoP, current US$ (per $ GDP) |
138.851 BoP $ per $1 million of |
[10th of 142] |
|
African countries by population density > area |
4,033 |
[49th of 56] |
|
African countries by population density > pop. dens. |
101 |
[12th of 56] |
|
African countries by population density > population |
408,760 |
[52nd of 56] |
|
Age dependency ratio > dependents to working-age population |
0.78 |
[45th of 185] |
|
Age structure > 0-14 years |
39 |
[57th of 226] |
|
Age structure > 0-14 years > Females |
76,489 |
[166th of 225] |
|
Age structure > 0-14 years > From total |
36.1% |
[66th of 227] |
|
Age structure > 0-14 years > Males |
77,533 |
[167th of 225] |
|
Age structure > 15-64 years |
54.3 |
[189th of 226] |
|
Age structure > 15-64 years > Females |
125,009 |
[171st of 225] |
|
Age structure > 15-64 years > From total |
57.4% |
[170th of 227] |
|
Age structure > 15-64 years > Males |
120,208 |
[172nd of 225] |
|
Age structure > 65 years and over > Females |
17,533 |
[162nd of 225] |
|
Age structure > 65 years and over > From total |
6.5% |
[99th of 227] |
|
Age structure > 65 years and over > Males |
10,226 |
[167th of 225] |
|
CPIA social protection rating |
4.5 |
[2nd of 75] |
|
Female population > Age 10-14 |
27,791 |
[167th of 224] |
|
Female population > Age 10-14 > % of the total |
6.6 |
[10th of 224] |
|
Female population > Age 15-19 |
26,312 |
[166th of 224] |
|
Female population > Age 15-19 > % of the total |
6.25 |
[6th of 224] |
|
Female population > Age 20-24 |
20,164 |
[168th of 224] |
|
Female population > Age 20-24 > % of the total |
4.79 |
[58th of 224] |
|
Female population > Age 25-29 |
14,266 |
[173rd of 224] |
|
Female population > Age 25-29 > % of the total |
3.39 |
[184th of 224] |
|
Female population > Age 30-34 |
10,000 |
[179th of 224] |
|
Female population > Age 30-34 > % of the total |
2.38 |
[221st of 224] |
|
Female population > Age 35-39 |
11,723 |
[174th of 224] |
|
Female population > Age 35-39 > % of the total |
2.78 |
[165th of 224] |
|
Female population > Age 40-44 |
12,573 |
[172nd of 224] |
|
Female population > Age 40-44 > % of the total |
2.99 |
[130th of 224] |
|
Female population > Age 45-49 |
10,410 |
[174th of 224] |
|
Female population > Age 45-49 > % of the total |
2.47 |
[134th of 224] |
|
Female population > Age 50-54 |
7,132 |
[177th of 224] |
|
Female population > Age 50-54 > % of the total |
1.69 |
[155th of 224] |
|
Female population > Age 55-59 |
3,485 |
[183rd of 224] |
|
Female population > Age 55-59 > % of the total |
0.83 |
[219th of 224] |
|
Female population > Age 60-64 |
3,358 |
[180th of 224] |
|
Female population > Age 60-64 > % of the total |
0.8 |
[198th of 224] |
|
Female population > Age 65-69 |
5,295 |
[166th of 224] |
|
Female population > Age 65-69 > % of the total |
1.26 |
[94th of 224] |
|
Female population > Age 70-74 |
4,861 |
[165th of 224] |
|
Female population > Age 70-74 > % of the total |
1.15 |
[81st of 224] |
|
Female population > Age 75-79 |
3,796 |
[164th of 224] |
|
Female population > Age 75-79 > % of the total |
0.9 |
[82nd of 224] |
|
Female population > Age 80-84 |
3,892 |
[158th of 224] |
|
Female population > Age 80-84 > % of the total |
0.92 |
[78th of 224] |
|
Gender development |
0.704 |
[80th of 141] |
|
Male population > Age 10-14 |
28,379 |
[167th of 224] |
|
Male population > Age 10-14 > % of the total |
6.74 |
[8th of 224] |
|
Male population > Age 15-19 |
26,966 |
[166th of 224] |
|
Male population > Age 15-19 > % of the total |
6.41 |
[7th of 224] |
|
Male population > Age 20-24 |
20,501 |
[167th of 224] |
|
Male population > Age 20-24 > % of the total |
4.87 |
[67th of 224] |
|
Male population > Age 25-29 |
13,608 |
[174th of 224] |
|
Male population > Age 25-29 > % of the total |
3.23 |
[200th of 224] |
|
Male population > Age 30-34 |
10,190 |
[180th of 224] |
|
Male population > Age 30-34 > % of the total |
2.42 |
[224th of 224] |
|
Male population > Age 35-39 |
11,949 |
[174th of 224] |
|
Male population > Age 35-39 > % of the total |
2.84 |
[168th of 224] |
|
Male population > Age 40-44 |
12,621 |
[171st of 224] |
|
Male population > Age 40-44 > % of the total |
3 |
[131st of 224] |
|
Male population > Age 45-49 |
8,200 |
[177th of 224] |
|
Male population > Age 45-49 > % of the total |
1.95 |
[162nd of 224] |
|
Male population > Age 50-54 |
4,702 |
[181st of 224] |
|
Male population > Age 50-54 > % of the total |
1.12 |
[201st of 224] |
|
Male population > Age 55-59 |
2,599 |
[187th of 224] |
|
Male population > Age 55-59 > % of the total |
0.62 |
[222nd of 224] |
|
Male population > Age 60-64 |
2,114 |
[188th of 224] |
|
Male population > Age 60-64 > % of the total |
0.5 |
[220th of 224] |
|
Male population > Age 65-69 |
2,999 |
[178th of 224] |
|
Male population > Age 65-69 > % of the total |
0.71 |
[146th of 224] |
|
Male population > Age 70-74 |
2,967 |
[170th of 224] |
|
Male population > Age 70-74 > % of the total |
0.7 |
[111st of 224] |
|
Male population > Age 75-79 |
2,413 |
[168th of 224] |
|
Male population > Age 75-79 > % of the total |
0.57 |
[91st of 224] |
|
Male population > Age 80-84 |
2,163 |
[163rd of 224] |
|
Male population > Age 80-84 > % of the total |
0.51 |
[76th of 224] |
|
Percentage living in rural areas. |
44% |
[93rd of 193] |
|
Percentage living in urban areas |
56% |
[106th of 199] |
|
Population > CIA Factbook |
426,998 |
[170th of 240] |
|
Population ages 0-14 > % of total |
39.54 % |
[49th of 185] |
|
Population ages 15-64 > % of total |
56.17 % |
[138th of 185] |
|
Population ages 65 and above > % of total |
4.29 % |
[108th of 185] |
|
Population growth > annual % |
2.32 annual % |
[37th of 195] |
|
Population, female > % of total |
52.1 % |
[16th of 190] |
|
Rights of the Child Convention > Ratification Dates |
4 Jun 1992 a |
|
|
Rural population |
216,406.6 |
[157th of 193] |
|
Rural population growth > annual % |
0.51 annual % |
[87th of 193] |
|
Sex ratio > 15-64 years |
0.94 |
[194th of 223] |
|
Sex ratio > sex ratios > 15–65 |
0.95 |
[182nd of 215] |
|
Sex ratio > sex ratios > at birth |
1.03 |
[177th of 215] |
|
Sex ratio > sex ratios > over 65 |
0.59 |
[205th of 215] |
|
Sex ratio > sex ratios > total |
0.95 |
[176th of 215] |
|
Sex ratio > sex ratios > under 15 |
1.02 |
[180th of 215] |
|
Total Population |
420,979 |
[172nd of 227] |
|
Total population > Age 10-14 |
56,170 |
[167th of 224] |
|
Total population > Age 10-14 > % of the total |
13.34 |
[10th of 224] |
|
Total population > Age 15-19 |
53,278 |
[166th of 224] |
|
Total population > Age 15-19 > % of the total |
12.66 |
[6th of 224] |
|
Total population > Age 20-24 |
40,665 |
[167th of 224] |
|
Total population > Age 20-24 > % of the total |
9.66 |
[63rd of 224] |
|
Total population > Age 25-29 |
27,874 |
[174th of 224] |
|
Total population > Age 25-29 > % of the total |
6.62 |
[194th of 224] |
|
Total population > Age 30-34 |
20,190 |
[179th of 224] |
|
Total population > Age 30-34 > % of the total |
4.8 |
[224th of 224] |
|
Total population > Age 35-39 |
23,672 |
[174th of 224] |
|
Total population > Age 35-39 > % of the total |
5.62 |
[171st of 224] |
|
Total population > Age 40-44 |
25,194 |
[171st of 224] |
|
Total population > Age 40-44 > % of the total |
5.98 |
[130th of 224] |
|
Total population > Age 45-49 |
18,610 |
[173rd of 224] |
|
Total population > Age 45-49 > % of the total |
4.42 |
[146th of 224] |
|
Total population > Age 50-54 |
11,834 |
[180th of 224] |
|
Total population > Age 50-54 > % of the total |
2.81 |
[181st of 224] |
|
Total population > Age 55-59 |
6,084 |
[184th of 224] |
|
Total population > Age 55-59 > % of the total |
1.45 |
[221st of 224] |
|
Total population > Age 60-64 |
5,472 |
[183rd of 224] |
|
Total population > Age 60-64 > % of the total |
1.3 |
[213rd of 224] |
|
Total population > Age 65-69 |
8,294 |
[172nd of 224] |
|
Total population > Age 65-69 > % of the total |
1.97 |
[117th of 224] |
|
Total population > Age 70-74 |
7,828 |
[169th of 224] |
|
Total population > Age 70-74 > % of the total |
1.86 |
[93rd of 224] |
|
Total population > Age 75-79 |
6,209 |
[165th of 224] |
|
Total population > Age 75-79 > % of the total |
1.47 |
[85th of 224] |
|
Total population > Age 80-84 |
6,055 |
[159th of 224] |
|
Total population > Age 80-84 > % of the total |
1.44 |
[77th of 224] |
|
Total Population > Female |
216,393 |
[171st of 227] |
|
Total Population > Male |
204,586 |
[172nd of 227] |
|
Urban population |
290,400.4 |
[160th of 195] |
|
Urban population growth > annual % |
3.69 annual % |
[34th of 195] |
|
Urbanization |
64 |
[81st of 204] |
|
Urbanization in 1975 |
21.4% |
[124th of 164] |
|
Urbanization in 2015 |
73.5% |
[50th of 164] |
|
Women > Adult literacy rate females as a % of males |
78 |
[101st of 144] |
|
Women > Antenatal care coverage % |
99 |
[14th of 133] |
|
Women > Contraceptive prevalence % |
53 |
[82nd of 170] |
|
Women > Life expectancy females as a % of males |
109 |
[38th of 173] |
|
Women > Maternal mortality ratio > reported |
76 |
[82nd of 154] |
|
Women > Maternal mortality ratio adjusted |
150 |
[70th of 166] |
|
Women > Skilled attendant at delivery % |
89 |
[90th of 172] |
|
Death rate, crude > per 1,000 people |
4.96 per 1,000 people |
[161st of 195] |
|
rate, adult, female > per 1,000 female adults |
108.64 per 1,000 female adults |
[100th of 185] |
|
rate, adult, male > per 1,000 male adults |
184.7 per 1,000 male adults |
[99th of 185] |
|
rate, infant > per 1,000 live births |
26 per 1,000 live births |
[86th of 187] |
|
rate, under-5 > per 1,000 |
35 per 1,000 |
[82nd of 187] |
|
immigrant population > Immigrants as percentage of state population |
2.17 |
[115th of 195] |
|
immigrant population > Number of immigrants |
11,000 |
[167th of 195] |
|
immigrant population > Percentage of total number of immigrants in the world |
>0.01% |
|
|
Net migration rate |
-11.74 migrant(s)/1,000 populati |
[172nd of 225] |
|
US visa lottery winners |
4 US visa lottery winners |
[146th of 178] |
| Other articles in this category |
|---|
| Cape Verde at a glance |
| Geography |
| History |
| Culture |
| Economy (1) |
| Economy (2) |
| Politics |
| Military |