1) Natural geography
|
Area > Comparative to US places |
||
|
Capital city with population |
Libreville - 419,596 |
|
|
Forested Land |
84.7% |
[5th of 193] |
|
Geographic coordinates |
1 00 S, 11 45 E |
|
|
Largest city population |
419,000 |
[124th of 174] |
|
Largest city with population |
Libreville - 419,596 |
|
|
northernmost point > Latitude |
02°19'N |
|
|
Population density |
4.76 people per sqkm |
[216th of 256] |
|
Population density > people per sq. km |
5.37 people/m² |
[193rd of 204] |
|
Precipitation |
2,841 mm |
[4th of 95] |
|
Rural population density > rural population per sq. km of arable land |
73.46 people/km² of arable lan |
[170th of 188] |
|
Surface area > sq. km |
267,670 km² |
[76th of 206] |
|
tallest mountains > Mountain |
Mont Bengoué |
|
SOURCES
All
CIA World
Factbooks 18 December 2003 to 18 December 2008; United Nations
World
Statistics Pocketbook and
Statistical
Yearbook, City Population, CIA World
Factbook, World Gazetteer,
Official government websites.; FAO; United Nations World
Statistics Pocketbook and
Statistical
Yearbook; Wikipedia:
List of countries by northernmost point ;
Heal The World
Foundation.; World
Development Indicators database; Wikipedia: List
of tallest mountains by country
ALTERNATIVE NAMES
Gabon, Gabonese Republic, Republique
Gabonaise
Environment
|
Acidification |
0% |
[121st of 141] |
|
Adjusted savings: carbon dioxide damage > % of GNI |
0.15 % of GNI |
[151st of 179] |
|
Areas under protection |
3 |
[138th of 146] |
|
Biodiversity richness |
2 |
[21st of 53] |
|
Biosphere reserves area |
15 thousand hectares |
[82nd of 86] |
|
Breeding birds threatened |
1.07% |
[111st of 136] |
|
Carbon efficiency |
1.01 CO2 emissions/$ GDP |
[79th of 141] |
|
CFC consumption |
126.65 |
[82nd of 107] |
|
CO2 Emissions |
1,454.6 |
[130th of 178] |
|
CO2 emissions > kg per 2000 PPP $ of GDP |
0.15 kg/PPP$ |
[138th of 170] |
|
CO2 emissions > kt |
1,223.44 kt |
[149th of 195] |
|
Ecological footprint |
2.06 |
[72nd of 141] |
|
Endangered species protection |
70% |
[70th of 141] |
|
Fertiliser consumption |
12.31 hundred grams/hectare |
[133rd of 141] |
|
Forest area > % of land area |
84.51 % of land area |
[6th of 195] |
|
Forest area > sq. km |
217,750 km² |
[27th of 195] |
|
Freshwater withdrawal |
0.12 |
[113rd of 124] |
|
Freshwater withdrawal > Agricultural |
42% |
[106th of 124] |
|
Freshwater withdrawal > Domestic |
50% |
[10th of 124] |
|
Freshwater withdrawal > Industrial |
8% |
[51st of 124] |
|
Groundwater withdrawals |
0.6 |
[83rd of 188] |
|
Known breeding bird species |
156 |
[111st of 146] |
|
Known mammal species |
190 |
[46th of 145] |
|
Marine areas under protection |
2 |
[79th of 95] |
|
Marine fish catch |
41,470 tons |
[69th of 141] |
|
Non-wildness |
0.15% |
[132nd of 141] |
|
NOx emissions per populated area |
0.11 thousand metric tons/squ |
[121st of 141] |
|
Organic water pollutant (BOD) emissions > kg per day |
1,886.23 kg/day |
[99th of 115] |
|
Organic water pollutant (BOD) emissions > kg per day per worker |
0.26 kg per day per worker |
[13th of 115] |
|
PM10, country level > micrograms per cubic meter |
6.37 mcg/m³ |
[181st of 185] |
|
Pollution > Carbon dioxide 1999 |
970 |
[115th of 199] |
|
Protected area |
2.8 |
[104th of 147] |
|
SO2 emissions per populated area |
110 thousand metric tons/squ |
[121st of 141] |
|
SO2 exports |
911.48 hundred metric tons |
[89th of 141] |
|
Threatened species |
20 |
[96th of 158] |
|
Threatened species > Mammal |
12 |
[67th of 160] |
|
Total renewable water resources |
164 cu km |
[6th of 31] |
|
Urban NO2 concentration |
54.6 micrograms/m3 |
[60th of 141] |
|
Urban SO2 concentration |
109.48 micrograms/m3 |
[19th of 141] |
|
Water > Availability |
176.37 thousand cubic metres |
[2nd of 141] |
|
Water > Dissolved oxygen concentration |
7.27 mls/litre |
[83rd of 141] |
|
Water > Phosphorus concentration |
0.29 mls/litre |
[85th of 141] |
|
Water > Salinisation |
777.5 |
[55th of 141] |
|
Water > Severe water stress |
0 |
[130th of 140] |
|
Water > Suspended solids |
6.26 mls/litre |
[32nd of 141] |
|
Water pollution, chemical industry > % of total BOD emissions |
4.94 % |
[79th of 114] |
|
Water pollution, clay and glass industry > % of total BOD emissions |
0.12 % |
[82nd of 112] |
|
Water pollution, food industry > % of total BOD emissions |
79.66 % |
[4th of 114] |
|
Water pollution, metal industry > % of total BOD emissions |
6.37 % |
[41st of 94] |
|
Water pollution, other industry > % of total BOD emissions |
1.19 % |
[80th of 107] |
|
Water pollution, paper and pulp industry > % of total BOD emissions |
6 % |
[87th of 111] |
|
Water pollution, textile industry > % of total BOD emissions |
1.21 % |
[102nd of 114] |
|
Water pollution, wood industry > % of total BOD emissions |
6.87 % |
[6th of 114] |
|
Wetlands of intl importance > Area |
1,080 thousand hectares |
[17th of 112] |
|
Wildness |
72.79% |
[8th of 141] |
SOURCES
Stockholm Environment Institute at York,
Acidification in Developing Countries: Ecosystem Sensitivity and the Critical
Loads Approach at the Global scale, 2000 via ciesin.org; World Development
Indicators database; World Resources Institute;
; 2000 IUCN Red List,
and World Resources Institute,World Resources 2000-2001, Washington, DC: WRI,
2000. Original sources: World Conservation Monitoring Center, IUCN-The World
Conservation Union, Food and Agriculture Organization of the United Nations and
other sources.; Carbon
Dioxide Information Analysis Center; UNEP, Production and Consumption of
Ozone Depleting Substances, 1986-1998, October 1999. via ciesin.org; World
Resources Institute. 2003. Carbon Emissions from energy use and cement
manufacturing, 1850 to 2000. Available on-line through the Climate Analysis Indicators Tool (CAIT) at
Washington, DC: World Resources Institute; World Wide Fund for Nature (WWF),
Living Planet Report 2000, Gland, Switzerland: 2000, and Redefining
Progress.;
Convention on International Trade in Endangered Species of Wild Fauna and Flora,
Report on National Reports Required Under Article VIII, Paragraph 7(a), of the
Convention, Eleventh Meeting of the Conference of the Parties, Gigiri, Kenya,
April 2000; World Bank, World Development Indicators 2001. Washington, DC: World
Bank, 2001. via ciesin.org; All CIA World
Factbooks 18 December 2003 to 18 December 2008;
FAOSTAT on-line database; Wild Areas Project
(WAP), joint Wildlife Conservation Society (WCS) and CIESIN project to map the
last wild places on the earth's surface. Accessed via ciesin.org;
Intergovernmental Panel on Climate Change: Special Report on
Emissions Scenarios, Data Version 1.1, B1Illustrative Marker Scenario with
model IMAGE; Gregg Marland, Tom Boden, and Bob Andres, University of North
Dakota, via net
publication;
Jacaranda Atlas; International Institute for Applied Systems Analysis,
RAINS-ASIA and Co-operative Programme formonitoring and evaluation of the long
range transmission of air pollutants in Europe (EMEP) via ciesin.org; United
Nations
World Statistics Pocketbook and
Statistical
Yearbook; World Resources Institute, World Resources 1998-99; World Bank,
World Development Indicators 2000; WHO,Air Management Information System-AMIS
2.0, 1998; and Global Urban Observatory, Citibase, 1999. via ciesin.org; Center
for Environmental Systems Research, University of Kassel, WaterGAP 2.1B, 2001
via ciesin.org; United Nations Environment Programme (UNEP), Global Environmental Monitoring System/Water
Quality Monitoring System, with data for an additional 29 countries from
Prescott-Allen,R. The Well being of Nations, Washington, DC: Island Press, 2001;
United Nations Environment Programme (UNEP),
Global Environmental Monitoring System/Water Quality Monitoring System, with
data for an additional 29 countries from Prescott-Allen, R. The Well being of
Nations, Washington, DC: Island Press, 2001; Center for Environmental Systems
Research, University of Kassel, WaterGap 2.1, 2000 via ciesin.org; Wild Areas
Project (WAP), joint Wildlife Conservation Society (WCS) and CIESIN project to
map the lastwild places on the earth's surface. via ciesin.org
ALTERNATIVE NAMES
Gabon, Gabonese Republic, Republique
Gabonaise
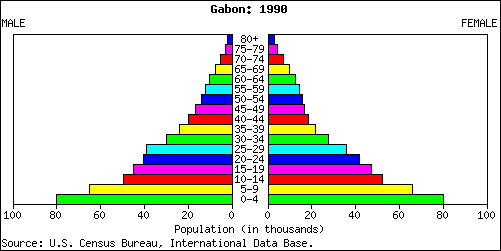
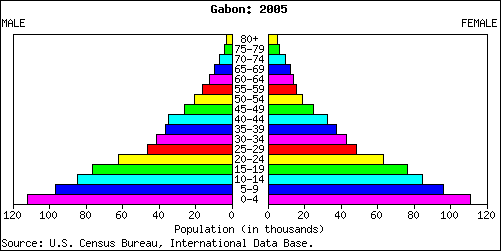
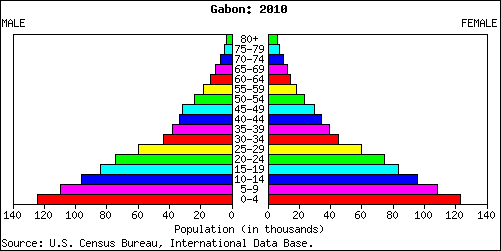
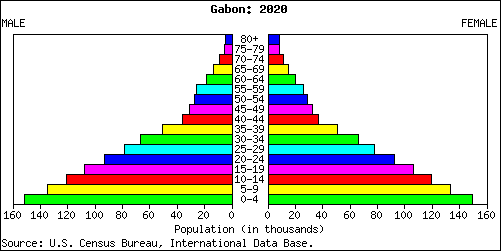
2) Human geography
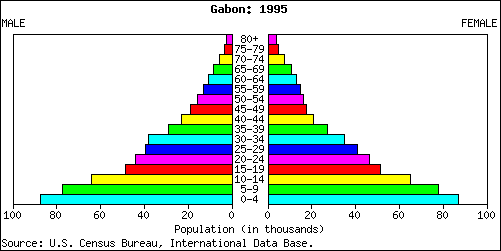
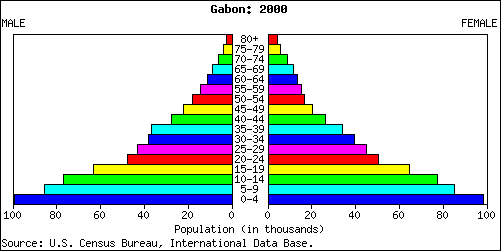
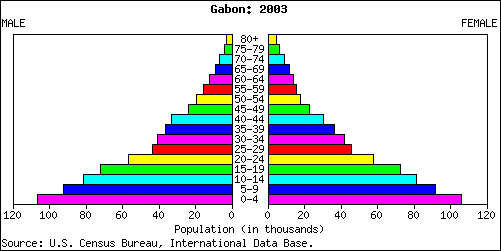
Age distribution
Gabon Population Pyramid for 1990
Age and sex distribution for the year 1990:
Age and sex distribution for the year 1995:
Age and sex distribution for the year 2000:
Age and sex distribution for the year 2003:
Age and sex distribution for the year 2005:
Age and sex distribution for the year 2010:
Predicted age and sex distribution for the year 2020:
Predicted age and sex distribution for the year 2050:
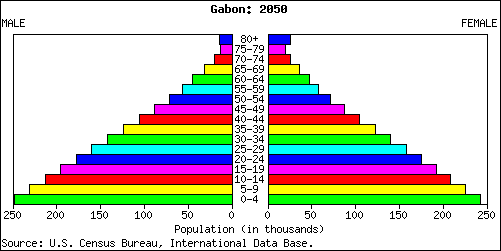
US Census Bureau July 17, 2003
Labor
|
Economic activity > Both sexes aged 10-14 |
14.07 |
[53rd of 89] |
|
Economic activity > Both sexes aged 15-19 |
52.21 |
[45th of 167] |
|
Economic activity > Both sexes aged 20-24 |
73.95 |
[79th of 166] |
|
Economic activity > Both sexes aged 25-29 |
82.4 |
[84th of 167] |
|
Economic activity > Both sexes aged 30-34 |
85.51 |
[72nd of 165] |
|
Economic activity > Both sexes aged 35-39 |
86.08 |
[77th of 166] |
|
Economic activity > Both sexes aged 40-44 |
85.27 |
[78th of 167] |
|
Economic activity > Both sexes aged 45-49 |
84.06 |
[69th of 163] |
|
Economic activity > Both sexes aged 50-54 |
81.67 |
[55th of 166] |
|
Economic activity > Both sexes aged 55-59 |
75.34 |
[40th of 166] |
|
Economic activity > Both sexes aged 60-64 |
64.96 |
[36th of 166] |
|
Economic activity > Both sexes aged 65 plus |
45.76 |
[36th of 165] |
|
Economic activity > Men aged 10-14 |
13.69 |
[59th of 92] |
|
Economic activity > Men aged 15-19 |
52.6 |
[63rd of 164] |
|
Economic activity > Men aged 20-24 |
83.61 |
[79th of 166] |
|
Economic activity > Men aged 25-29 |
95.62 |
[69th of 165] |
|
Economic activity > Men aged 30-34 |
96.52 |
[125th of 165] |
|
Economic activity > Men aged 35-39 |
96.53 |
[133rd of 164] |
|
Economic activity > Men aged 40-44 |
96.5 |
[110th of 163] |
|
Economic activity > Men aged 45-49 |
94.67 |
[118th of 167] |
|
Economic activity > Men aged 50-54 |
93.39 |
[78th of 165] |
|
Economic activity > Men aged 55-59 |
89.4 |
[68th of 167] |
|
Economic activity > Men aged 60-64 |
77.49 |
[60th of 165] |
|
Economic activity > Men aged 65 plus |
58.7 |
[41st of 162] |
|
Economic activity > Women aged 10-14 |
14.46 |
[46th of 89] |
|
Economic activity > Women aged 15-19 |
51.82 |
[37th of 164] |
|
Economic activity > Women aged 20-24 |
64.35 |
[83rd of 166] |
|
Economic activity > Women aged 25-29 |
69.38 |
[85th of 165] |
|
Economic activity > Women aged 30-34 |
74.71 |
[72nd of 167] |
|
Economic activity > Women aged 35-39 |
75.85 |
[73rd of 165] |
|
Economic activity > Women aged 40-44 |
74.32 |
[75th of 165] |
|
Economic activity > Women aged 45-49 |
73.79 |
[66th of 161] |
|
Economic activity > Women aged 50-54 |
70.48 |
[58th of 166] |
|
Economic activity > Women aged 55-59 |
62.64 |
[38th of 167] |
|
Economic activity > Women aged 60-64 |
53.92 |
[27th of 165] |
|
Economic activity > Women aged 65 plus |
34.95 |
[18th of 167] |
|
Female economic activity |
63.2% |
[36th of 156] |
|
Female economic activity growth |
1% |
[98th of 156] |
|
Firing cost > weeks of wages |
43.3 weeks of wages |
[75th of 164] |
|
force participation rate, female > % of female population ages 15-64 |
64.15 % |
[58th of 184] |
|
force participation rate, male > % of male population ages 15-64 |
83.95 % |
[66th of 184] |
|
force participation rate, total > % of total population ages 15-64 |
73.99 % |
[52nd of 184] |
|
force, female > % of total labor force |
43.32 % |
[81st of 184] |
|
force, total |
596,516.2 |
[147th of 184] |
|
Labor
force > By occupation |
||
|
Parental leave > Paid maternity leave |
14 weeks |
|
|
Parental leave > Paid paternity leave |
||
|
Right to Organise and Collective Bargaining Convention > Ratifications > Date |
May 29, 1951 |
|
|
Rigidity of employment index |
59 |
[23rd of 166] |
|
Unemployment with secondary education, female > % of female unemployment |
6.6 % |
[44th of 71] |
|
Unemployment with secondary education, male > % of male unemployment |
10.3 % |
[43rd of 71] |
|
Unemployment with tertiary education > % of total unemployment |
8.2 % |
[28th of 77] |
|
Unemployment with tertiary education, female > % of female unemployment |
8.5 % |
[29th of 71] |
|
Unemployment with tertiary education, male > % of male unemployment |
8.1 % |
[23rd of 71] |
|
Unemployment, female > % of female labor force |
16.4 % |
[15th of 95] |
|
Unemployment, male > % of male labor force |
19.3 % |
[4th of 95] |
|
Unemployment, total > % of total labor force |
18 % |
[8th of 101] |
|
Workers' remittances and compensation of employees, paid > US$ |
110,000,000 $ |
[61st of 149] |
|
Workers' remittances and compensation of employees, paid > US$ (per $ GDP) |
13.655 $ per $1,000 of GDP |
[38th of 166] |
|
Workers' remittances and compensation of employees, received > US$ |
6,000,000 $ |
[141st of 156] |
|
Workers' remittances and compensation of employees, received > US$ (per $ GDP) |
0.745 $ per $1,000 of GDP |
[144th of 165] |
|
Workers' remittances, receipts > BoP, current US$ |
1,431,046 BoP $ |
[108th of 115] |
|
Workers' remittances, receipts > BoP, current US$ (per $ GDP) |
0.198 BoP $ per $1 million of |
[99th of 142] |
SOURCES
Economic activity rate and economically active
population, by sex, thirteen age groups, 1950-2010 (ILO estimates and
projections) are data from the International Labour Union (ILO). Source details:
ILO, Economically Active Population, 1950-2010, fourth edition, diskette
database (Geneva, 1997). The latest set of estimates and projections covering
the period 1950-2010 (4th edition) was released by ILO in December 1996. These
data are updated every five-ten years by ILO and a new set of these data is in
preparation; calculated on the basis of data on the economically active
population and total population from ILO (International Labour Organization).
2002. Estimates and Projections of the Economically Active Population,
1950-2010, 4th ed., rev. 2. Database. Geneva; World Development
Indicators database; All
CIA World
Factbooks 18 December 2003 to 18 December 2008; Wikipedia: Parental leave ;
Wikipedia:
Right to Organise and Collective Bargaining Convention, 1949
ALTERNATIVE NAMES
Gabon, Gabonese Republic, Republique
Gabonaise
People
|
African countries by population density > area |
267,667 |
[29th of 56] |
|
African countries by population density > pop. dens. |
4.6 |
[52nd of 56] |
|
African countries by population density > population |
1,233,353 |
[45th of 56] |
|
Age dependency ratio > dependents to working-age population |
0.8 |
[40th of 185] |
|
Age structure > 0-14 years |
42.1 |
[41st of 226] |
|
Age structure > 0-14 years > Females |
311,900 |
[144th of 225] |
|
Age structure > 0-14 years > From total |
42.1% |
[35th of 227] |
|
Age structure > 0-14 years > Males |
314,078 |
[144th of 225] |
|
Age structure > 15-64 years |
53.8 |
[197th of 226] |
|
Age structure > 15-64 years > Females |
401,602 |
[151st of 225] |
|
Age structure > 15-64 years > From total |
53.9% |
[189th of 227] |
|
Age structure > 15-64 years > Males |
399,586 |
[153rd of 225] |
|
Age structure > 65 years and over > Females |
34,278 |
[150th of 225] |
|
Age structure > 65 years and over > From total |
3.9% |
[148th of 227] |
|
Age structure > 65 years and over > Males |
24,388 |
[152nd of 225] |
|
Child Protection > Birth registration, % of rural |
87 |
[11th of 52] |
|
Child Protection > Birth registration, % of total |
89 |
[14th of 56] |
|
Child Protection > Birth registration, % of urban |
90 |
[15th of 52] |
|
Chinese population |
100 |
[109th of 127] |
|
Female population > Age 10-14 |
86,704 |
[148th of 224] |
|
Female population > Age 10-14 > % of the total |
6.08 |
[50th of 224] |
|
Female population > Age 15-19 |
78,429 |
[148th of 224] |
|
Female population > Age 15-19 > % of the total |
5.5 |
[53rd of 224] |
|
Female population > Age 20-24 |
66,302 |
[150th of 224] |
|
Female population > Age 20-24 > % of the total |
4.65 |
[77th of 224] |
|
Female population > Age 25-29 |
51,408 |
[151st of 224] |
|
Female population > Age 25-29 > % of the total |
3.61 |
[152nd of 224] |
|
Female population > Age 30-34 |
42,339 |
[152nd of 224] |
|
Female population > Age 30-34 > % of the total |
2.97 |
[194th of 224] |
|
Female population > Age 35-39 |
37,597 |
[150th of 224] |
|
Female population > Age 35-39 > % of the total |
2.64 |
[181st of 224] |
|
Female population > Age 40-44 |
32,696 |
[151st of 224] |
|
Female population > Age 40-44 > % of the total |
2.29 |
[169th of 224] |
|
Female population > Age 45-49 |
26,114 |
[154th of 224] |
|
Female population > Age 45-49 > % of the total |
1.83 |
[177th of 224] |
|
Female population > Age 50-54 |
19,943 |
[156th of 224] |
|
Female population > Age 50-54 > % of the total |
1.4 |
[196th of 224] |
|
Female population > Age 55-59 |
16,134 |
[155th of 224] |
|
Female population > Age 55-59 > % of the total |
1.13 |
[189th of 224] |
|
Female population > Age 60-64 |
13,914 |
[154th of 224] |
|
Female population > Age 60-64 > % of the total |
0.98 |
[157th of 224] |
|
Female population > Age 65-69 |
11,991 |
[151st of 224] |
|
Female population > Age 65-69 > % of the total |
0.84 |
[142nd of 224] |
|
Female population > Age 70-74 |
9,548 |
[151st of 224] |
|
Female population > Age 70-74 > % of the total |
0.67 |
[135th of 224] |
|
Female population > Age 75-79 |
6,508 |
[150th of 224] |
|
Female population > Age 75-79 > % of the total |
0.46 |
[138th of 224] |
|
Female population > Age 80-84 |
5,215 |
[152nd of 224] |
|
Female population > Age 80-84 > % of the total |
0.37 |
[133rd of 224] |
|
Male population > Age 10-14 |
86,791 |
[147th of 224] |
|
Male population > Age 10-14 > % of the total |
6.09 |
[57th of 224] |
|
Male population > Age 15-19 |
78,288 |
[149th of 224] |
|
Male population > Age 15-19 > % of the total |
5.49 |
[66th of 224] |
|
Male population > Age 20-24 |
65,808 |
[150th of 224] |
|
Male population > Age 20-24 > % of the total |
4.62 |
[101st of 224] |
|
Male population > Age 25-29 |
49,786 |
[152nd of 224] |
|
Male population > Age 25-29 > % of the total |
3.49 |
[184th of 224] |
|
Male population > Age 30-34 |
41,091 |
[154th of 224] |
|
Male population > Age 30-34 > % of the total |
2.88 |
[213rd of 224] |
|
Male population > Age 35-39 |
37,075 |
[153rd of 224] |
|
Male population > Age 35-39 > % of the total |
2.6 |
[189th of 224] |
|
Male population > Age 40-44 |
34,155 |
[153rd of 224] |
|
Male population > Age 40-44 > % of the total |
2.4 |
[167th of 224] |
|
Male population > Age 45-49 |
27,323 |
[154th of 224] |
|
Male population > Age 45-49 > % of the total |
1.92 |
[163rd of 224] |
|
Male population > Age 50-54 |
20,520 |
[154th of 224] |
|
Male population > Age 50-54 > % of the total |
1.44 |
[166th of 224] |
|
Male population > Age 55-59 |
16,369 |
[154th of 224] |
|
Male population > Age 55-59 > % of the total |
1.15 |
[160th of 224] |
|
Male population > Age 60-64 |
12,722 |
[153rd of 224] |
|
Male population > Age 60-64 > % of the total |
0.89 |
[152nd of 224] |
|
Male population > Age 65-69 |
9,478 |
[153rd of 224] |
|
Male population > Age 65-69 > % of the total |
0.67 |
[160th of 224] |
|
Male population > Age 70-74 |
6,744 |
[152nd of 224] |
|
Male population > Age 70-74 > % of the total |
0.47 |
[161st of 224] |
|
Male population > Age 75-79 |
4,262 |
[154th of 224] |
|
Male population > Age 75-79 > % of the total |
0.3 |
[158th of 224] |
|
Male population > Age 80-84 |
3,092 |
[154th of 224] |
|
Male population > Age 80-84 > % of the total |
0.22 |
[144th of 224] |
|
Percentage living in rural areas. |
16% |
[162nd of 193] |
|
Percentage living in urban areas |
84% |
[39th of 199] |
|
Population > CIA Factbook |
1,485,832 |
[150th of 240] |
|
Population ages 0-14 > % of total |
40.05 % |
[46th of 185] |
|
Population ages 15-64 > % of total |
55.6 % |
[144th of 185] |
|
Population ages 65 and above > % of total |
4.35 % |
[106th of 185] |
|
Population growth > annual % |
1.57 annual % |
[81st of 195] |
|
Population, female > % of total |
50.2 % |
[114th of 190] |
|
Projected population growth |
48.57% |
[71st of 141] |
|
Rights of the Child Convention > Ratification Dates |
9 Feb 1994 |
|
|
Rights of the Child Convention > Signatories |
26 Jan 1990 |
|
|
Rural population |
226,949.9 |
[156th of 193] |
|
Rural population growth > annual % |
-2.61 annual % |
[185th of 193] |
|
Sex ratio > 15-64 years |
0.99 |
[134th of 223] |
|
Sex ratio > sex ratios > 15–65 |
0.99 |
[136th of 215] |
|
Sex ratio > sex ratios > at birth |
1.03 |
[190th of 215] |
|
Sex ratio > sex ratios > over 65 |
1.05 |
[14th of 215] |
|
Sex ratio > sex ratios > total |
1 |
[79th of 215] |
|
Sex ratio > sex ratios > under 15 |
1.01 |
[189th of 215] |
|
Total Population |
1,424,906 |
[151st of 227] |
|
Total population > Age 10-14 |
173,495 |
[148th of 224] |
|
Total population > Age 10-14 > % of the total |
12.18 |
[52nd of 224] |
|
Total population > Age 15-19 |
156,717 |
[149th of 224] |
|
Total population > Age 15-19 > % of the total |
11 |
[59th of 224] |
|
Total population > Age 20-24 |
132,110 |
[150th of 224] |
|
Total population > Age 20-24 > % of the total |
9.27 |
[87th of 224] |
|
Total population > Age 25-29 |
101,194 |
[152nd of 224] |
|
Total population > Age 25-29 > % of the total |
7.1 |
[168th of 224] |
|
Total population > Age 30-34 |
83,430 |
[152nd of 224] |
|
Total population > Age 30-34 > % of the total |
5.86 |
[204th of 224] |
|
Total population > Age 35-39 |
74,672 |
[151st of 224] |
|
Total population > Age 35-39 > % of the total |
5.24 |
[188th of 224] |
|
Total population > Age 40-44 |
66,851 |
[152nd of 224] |
|
Total population > Age 40-44 > % of the total |
4.69 |
[168th of 224] |
|
Total population > Age 45-49 |
53,437 |
[154th of 224] |
|
Total population > Age 45-49 > % of the total |
3.75 |
[170th of 224] |
|
Total population > Age 50-54 |
40,463 |
[156th of 224] |
|
Total population > Age 50-54 > % of the total |
2.84 |
[177th of 224] |
|
Total population > Age 55-59 |
32,503 |
[154th of 224] |
|
Total population > Age 55-59 > % of the total |
2.28 |
[176th of 224] |
|
Total population > Age 60-64 |
26,636 |
[154th of 224] |
|
Total population > Age 60-64 > % of the total |
1.87 |
[158th of 224] |
|
Total population > Age 65-69 |
21,469 |
[151st of 224] |
|
Total population > Age 65-69 > % of the total |
1.51 |
[150th of 224] |
|
Total population > Age 70-74 |
16,292 |
[152nd of 224] |
|
Total population > Age 70-74 > % of the total |
1.14 |
[142nd of 224] |
|
Total population > Age 75-79 |
10,770 |
[154th of 224] |
|
Total population > Age 75-79 > % of the total |
0.76 |
[142nd of 224] |
|
Total population > Age 80-84 |
8,307 |
[152nd of 224] |
|
Total population > Age 80-84 > % of the total |
0.58 |
[140th of 224] |
|
Total Population > Female |
717,279 |
[151st of 227] |
|
Total Population > Male |
707,627 |
[150th of 227] |
|
Urban population |
1,156,891 |
[138th of 195] |
|
Urban population growth > annual % |
2.41 annual % |
[80th of 195] |
|
Urbanization |
82 |
[37th of 204] |
|
Urbanization in 1975 |
40% |
[88th of 164] |
|
Urbanization in 2015 |
88.9% |
[23rd of 164] |
|
Women > Adult literacy rate females as a % of males |
78 |
[103rd of 144] |
|
Women > Antenatal care coverage % |
94 |
[42nd of 133] |
|
Women > Contraceptive prevalence % |
33 |
[119th of 170] |
|
Women > Life expectancy females as a % of males |
104 |
[141st of 173] |
|
Women > Maternal mortality ratio > reported |
520 |
[29th of 154] |
|
Women > Maternal mortality ratio adjusted |
420 |
[49th of 166] |
|
Women > Skilled attendant at delivery % |
86 |
[97th of 172] |
SOURCES
Wikipedia:
List of African countries by population density ;
World Development
Indicators database;
CIA World Factbook, 28 July 2005; All
CIA World
Factbooks 18 December 2003 to 18 December 2008;
UNICEF;
University Libraries, Ohio University;
U.S. Census Bureau,
Population Division, International Programs Center ; Population Division of
the United Nations Secretariat, World Urbanization Prospects: The 2003 Revision,
Data Tables and Highlights. Estimates and projections of urban and rural
populations are made by the Population Division of the United Nations
Secretariat and published every two years. These estimates and projections are
based on national census or survey data that have been evaluated and, whenever
necessary, adjusted for deficiencies and inconsistencies; Population Reference
Bureau, 2001 World Population Data Sheet, Washington, DC: PRB, 2001. via
ciesin.org; The Office of the High Commissioner for Human Rights; The Office of
the High Commissioner for Human RIghts; Wikipedia: Sex ratio ;
U.S. Census Bureau,
Population Division, International Programs Center Spanish Statistical Institute; Population
Division of the United Nations Secretariat, World Urbanization Prospects: The
2001 Revision, Data Tables and Highlights (ESA/P/WP.173, 20 March 2002); UN
(United Nations). 2002. World Urbanization Prospects: The 2001 Revision.
Department of Economic and Social Affairs, Population Division. New York
ALTERNATIVE NAMES
Gabon, Gabonese Republic, Republique
Gabonaise
Mortality
|
Death rate, crude > per 1,000 people |
12.79 per 1,000 people |
[43rd of 195] |
|
rate, adult, female > per 1,000 female adults |
431.72 per 1,000 female adults |
[25th of 185] |
|
rate, adult, male > per 1,000 male adults |
438.05 per 1,000 male adults |
[30th of 185] |
|
rate, infant > per 1,000 live births |
60 per 1,000 live births |
[51st of 187] |
|
rate, under-5 > per 1,000 |
91 per 1,000 |
[45th of 187] |
SOURCES
World Development
Indicators database
ALTERNATIVE NAMES
Gabon, Gabonese Republic, Republique
Gabonaise
Immigration
|
immigrant population > Immigrants as percentage of state population |
17.7 |
[24th of 195] |
|
immigrant population > Number of immigrants |
245,000 |
[87th of 195] |
|
immigrant population > Percentage of total number of immigrants in the world |
>0.5% |
|
|
Net migration rate |
-3.62 migrant(s)/1,000 populati |
[150th of 225] |
|
Refugees |
1,670 |
[82nd of 110] |
|
Refugees > Convention on refugees |
27 Apr 1964 a |
|
|
Refugees and internally displaced persons > Refugees (country of origin) |
7,178 (Republic of Congo) |
|
|
US visa lottery winners |
14 US visa lottery winners |
[123rd of 178] |
SOURCES
Wikipedia:
List of countries by immigrant population ; All
CIA World
Factbooks 18 December 2003 to 18 December 2008; United Nations
World
Statistics Pocketbook and
Statistical
Yearbook; United Nations Treaty Collection; US Department of State: Bureau
of Consular Affairs
ALTERNATIVE NAMES
Gabon, Gabonese Republic, Republique
Gabonaise


| Other articles in this category |
|---|
| Gabon at a glance |
| Geography |
| History |
| Culture |
| Economy (1) |
| Economy (2) |
| Politics |
| Military |