1) Natural geography
|
Area > A
note includes Agalega Islands, Cargados Carajos Shoals (Saint Brandon), and Rodrigues |
||
|
Area > Comparative to US places almost 11 times the size of Washington, DC |
||
| Capital city with population | Port Louis - 134,516 | |
| Forested Land | 7.9% | [153rd of 193] |
| Geographic coordinates | 20 17 S, 57 33 E | |
| Largest city | Port Louis | |
| Largest city population | 165,000 | [141st of 174] |
| Largest city with population | Port Louis - 134,516 | |
| northernmost point > Latitude | 10°25'S | |
| Population density | 639.03 people per sqkm | [14th of 256] |
| Population density > people per sq. km | 612.44 people/m² | [11th of 204] |
| Precipitation | 1,793 mm | [13th of 95] |
| Rural population density > rural population per sq. km of arable land | 716.11 people/km² of arable lan | [8th of 188] |
| Surface area > sq. km | 2,040 km² | [171st of 206] |
| tallest mountains > Mountain | Mont Piton | |
| Adjusted savings: carbon dioxide damage > % of GNI | 0.36 % of GNI | [90th of 179] |
| Adjusted savings: net forest depletion > % of GNI | 0.01 % of GNI | [56th of 57] |
| Biodiversity richness | 3 | [4th of 53] |
| CO2 Emissions | 2,796 | [117th of 178] |
| CO2 emissions > kg per 2000 PPP $ of GDP | 0.25 kg/PPP$ | [106th of 170] |
| CO2 emissions > kt | 3,142.85 kt | [123rd of 195] |
| Forest area > % of land area | 18.23 % of land area | [130th of 195] |
| Forest area > sq. km | 370 km² | [168th of 195] |
| Freshwater withdrawal | 0.61 | [91st of 124] |
| Freshwater withdrawal > Agricultural | 60% | [91st of 124] |
| Freshwater withdrawal > Domestic | 25% | [30th of 124] |
| Freshwater withdrawal > Industrial | 14% | [33rd of 124] |
| Groundwater withdrawals | 216.2 | [20th of 188] |
| Organic water pollutant (BOD) emissions > kg per day | 17,699.61 kg/day | [56th of 115] |
| Organic water pollutant (BOD) emissions > kg per day per worker | 0.15 kg per day per worker | [62nd of 115] |
| PM10, country level > micrograms per cubic meter | 15.95 mcg/m³ | [163rd of 185] |
| Pollution > Carbon dioxide 1999 | 674 | [121st of 199] |
| Protected area | 6 | [70th of 147] |
| Threatened species | 52 | [39th of 158] |
| Threatened species > Mammal | 4 | [134th of 160] |
| Total renewable water resources | 2.2 cu km | [17th of 31] |
| Water pollution, chemical industry > % of total BOD emissions | 2.59 % | [69th of 114] |
| Water pollution, clay and glass industry > % of total BOD emissions | 0.06 % | [68th of 112] |
| Water pollution, food industry > % of total BOD emissions | 32.82 % | [65th of 114] |
| Water pollution, metal industry > % of total BOD emissions | 0.89 % | [62nd of 94] |
| Water pollution, other industry > % of total BOD emissions | 1.1 % | [62nd of 107] |
| Water pollution, paper and pulp industry > % of total BOD emissions | 6.56 % | [67th of 111] |
| Water pollution, textile industry > % of total BOD emissions | 55.37 % | [2nd of 114] |
| Water pollution, wood industry > % of total BOD emissions | 0.61 % | [69th of 114] |
SOURCES
World Development
Indicators database; ; World Resources Institute. 2003. Carbon Emissions
from energy use and cement manufacturing, 1850 to 2000. Available on-line
through the Climate Analysis Indicators Tool
(CAIT) at Washington, DC: World Resources Institute; All
CIA World
Factbooks 18 December 2003 to 18 December 2008; Gregg Marland, Tom Boden,
and Bob Andres, University of North Dakota, via
net publication;
Jacaranda Atlas; United Nations
World
Statistics Pocketbook and
Statistical
Yearbook
ALTERNATIVE NAMES
Mauritius, Republic of Mauritius
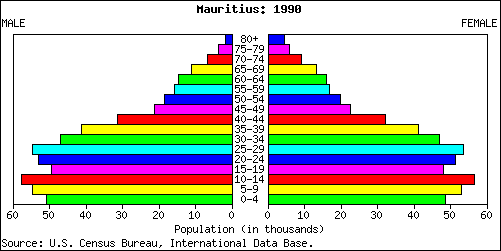
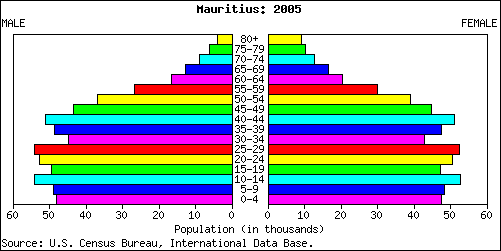
2) Human geography
Age distribution
Mauritius Population Pyramid for 1990
Age and sex distribution for the year 1990
| Agricultural workers > Female | 13% | [24th of 77] |
| Agricultural workers > Male | 15% | [35th of 78] |
| Compensation of employees > % of expense | 39.46 % | [11th of 97] |
| Compensation of employees > current LCU | 15022300000 | |
| Economic activity > Both sexes aged 15-19 | 36.26 | [93rd of 167] |
| Economic activity > Both sexes aged 20-24 | 69.16 | [116th of 166] |
| Economic activity > Both sexes aged 25-29 | 71.99 | [141st of 167] |
| Economic activity > Both sexes aged 35-39 | 74.6 | [134th of 166] |
| Economic activity > Both sexes aged 40-44 | 71.5 | [138th of 167] |
| Economic activity > Both sexes aged 45-49 | 67.88 | [139th of 163] |
| Economic activity > Both sexes aged 50-54 | 62.02 | [139th of 166] |
| Economic activity > Both sexes aged 55-59 | 49.83 | [139th of 166] |
| Economic activity > Both sexes aged 60-64 | 15.77 | [160th of 166] |
| Economic activity > Both sexes aged 65 plus | 7.97 | [134th of 165] |
| Economic activity > Men aged 10-14 | 2.94 | [79th of 92] |
| Economic activity > Men aged 15-19 | 44.93 | [82nd of 164] |
| Economic activity > Men aged 20-24 | 88.57 | [35th of 166] |
| Economic activity > Men aged 25-29 | 94.69 | [108th of 165] |
| Economic activity > Men aged 30-34 | 96.67 | [117th of 165] |
| Economic activity > Men aged 35-39 | 97.01 | [115th of 164] |
| Economic activity > Men aged 40-44 | 96.42 | [112nd of 163] |
| Economic activity > Men aged 45-49 | 94.42 | [124th of 167] |
| Economic activity > Men aged 50-54 | 90.37 | [117th of 165] |
| Economic activity > Men aged 55-59 | 79.16 | [118th of 167] |
| Economic activity > Men aged 60-64 | 25.32 | [156th of 165] |
| Economic activity > Men aged 65 plus | 14.04 | [124th of 162] |
| Economic activity > Women aged 10-14 | 1.04 | [86th of 89] |
| Economic activity > Women aged 15-19 | 27.31 | [99th of 164] |
| Economic activity > Women aged 20-24 | 49.19 | [129th of 166] |
| Economic activity > Women aged 25-29 | 48.24 | [140th of 165] |
| Economic activity > Women aged 30-34 | 52.04 | [135th of 167] |
| Economic activity > Women aged 35-39 | 51.36 | [133rd of 165] |
| Economic activity > Women aged 40-44 | 45.9 | [134th of 165] |
| Economic activity > Women aged 45-49 | 41.15 | [133rd of 161] |
| Economic activity > Women aged 50-54 | 35.13 | [137th of 166] |
| Economic activity > Women aged 55-59 | 23.72 | [135th of 167] |
| Economic activity > Women aged 60-64 | 7.67 | [157th of 165] |
| Economic activity > Women aged 65 plus | 3.66 | [128th of 167] |
| Female decision makers | 23% | [53rd of 67] |
| Female economic activity | 37.9% | [127th of 156] |
| Female economic activity growth | 9% | [43rd of 156] |
| Female professionals | 38% | [63rd of 68] |
| Firing cost > weeks of wages | 34.7 weeks of wages | [91st of 164] |
| force participation rate, female > % of female population ages 15-64 | 46.86 % | [145th of 184] |
| force participation rate, male > % of male population ages 15-64 | 84.13 % | [64th of 184] |
| force participation rate, total > % of total population ages 15-64 | 65.51 % | [125th of 184] |
| force with primary education > % of total | 65.6 % | [3rd of 48] |
| force with secondary education > % of total | 25.8 % | [29th of 51] |
| force with tertiary education > % of total | 2.5 % | [41st of 52] |
| force, female > % of total labor force | 35.66 % | [146th of 184] |
| force, total | 568,194.4 | [148th of 184] |
| Industrial workers > Female | 43% | [1st of 79] |
| Industrial workers > Male | 39% | [14th of 79] |
|
Labor
force > By occupation agriculture and fishing 14%, construction and industry 36%, transportation and communication 7%, trade, restaurants, hotels 16%, finance 3%, other services 24% |
||
| Minimum Age Convention, 1973 > Ratifications > Date | July 30, 1990 | |
| Minimum Age Convention, 1973 > Ratifications > Minimum age | 15 | [86th of 146] |
| Parental leave > Paid maternity leave | 12 weeks | |
| regulations > % of managers surveyed ranking this as a major business constraint | 27.8 % | [1st of 39] |
| Right to Organise and Collective Bargaining Convention > Ratifications > Date | December 2, 1969 | |
| Rigidity of employment index | 30 | [108th of 166] |
| Service workers > Female | 45% | [71st of 79] |
| Service workers > Male | 46% | [57th of 79] |
| skills > % of managers surveyed ranking this as a major business constraint | 42.93 % | [1st of 38] |
| Technicians in R&D > per million people | 157.26 per million people | [7th of 49] |
| Unemployment with secondary education, female > % of female unemployment | 34.4 % | [41st of 71] |
| Unemployment with secondary education, male > % of male unemployment | 20 % | [50th of 71] |
| Unemployment, female > % of female labor force | 13.5 % | [17th of 95] |
| Unemployment, male > % of male labor force | 5.8 % | [51st of 95] |
| Unemployment, total > % of total labor force | 8.5 % | [36th of 101] |
| Unemployment, youth female > % of female labor force ages 15-24 | 34.3 % | [7th of 77] |
| Unemployment, youth male > % of male labor force ages 15-24 | 20.5 % | [13th of 77] |
| Unemployment, youth total > % of total labor force ages 15-24 | 25.9 % | [9th of 77] |
| Workers' remittances and compensation of employees, paid > US$ | 11,000,000 $ | [120th of 149] |
| Workers' remittances and compensation of employees, paid > US$ (per $ GDP) | 1.749 $ per $1,000 of GDP | [98th of 166] |
| Workers' remittances and compensation of employees, received > US$ | 215,000,000 $ | [93rd of 156] |
| Workers' remittances and compensation of employees, received > US$ (per $ GDP) | 34.183 $ per $1,000 of GDP | [51st of 165] |
| African countries by population density > area | 2,040 | [52nd of 56] |
| African countries by population density > pop. dens. | 588 | [1st of 56] |
| African countries by population density > population | 1,200,206 | [46th of 56] |
| Age dependency ratio > dependents to working-age population | 0.45 | [154th of 185] |
| Age structure > 0-14 years | 24.4 | [143rd of 226] |
| Age structure > 0-14 years > Females | 143,859 | [153rd of 225] |
| Age structure > 0-14 years > From total | 23% | [142nd of 227] |
| Age structure > 0-14 years > Males | 148,573 | [153rd of 225] |
| Age structure > 15-64 years | 69.1 | [31st of 226] |
| Age structure > 15-64 years > Females | 449,670 | [149th of 225] |
| Age structure > 15-64 years > From total | 70.1% | [30th of 227] |
| Age structure > 15-64 years > Males | 443,968 | [149th of 225] |
| Age structure > 65 years and over > Females | 52,850 | [142nd of 225] |
| Age structure > 65 years and over > From total | 6.9% | [92nd of 227] |
| Age structure > 65 years and over > Males | 35,269 | [147th of 225] |
| Chinese population | 40,000 | [27th of 127] |
| Divorce rate | 0.47 per 1,000 people | [25th of 34] |
| Female population > Age 10-14 | 52,080 | [153rd of 224] |
| Female population > Age 10-14 > % of the total | 4.2 | [138th of 224] |
| Female population > Age 15-19 | 49,054 | [155th of 224] |
| Female population > Age 15-19 > % of the total | 3.95 | [154th of 224] |
| Female population > Age 20-24 | 47,700 | [156th of 224] |
| Female population > Age 20-24 > % of the total | 3.84 | [155th of 224] |
| Female population > Age 25-29 | 54,180 | [150th of 224] |
| Female population > Age 25-29 > % of the total | 4.37 | [29th of 224] |
| Female population > Age 30-34 | 44,629 | [150th of 224] |
| Female population > Age 30-34 > % of the total | 3.6 | [102nd of 224] |
| Female population > Age 35-39 | 44,859 | [146th of 224] |
| Female population > Age 35-39 > % of the total | 3.62 | [76th of 224] |
| Female population > Age 40-44 | 51,751 | [143rd of 224] |
| Female population > Age 40-44 > % of the total | 4.17 | [24th of 224] |
| Female population > Age 45-49 | 46,101 | [144th of 224] |
| Female population > Age 45-49 > % of the total | 3.72 | [40th of 224] |
| Female population > Age 50-54 | 39,867 | [143rd of 224] |
| Female population > Age 50-54 > % of the total | 3.21 | [56th of 224] |
| Female population > Age 55-59 | 31,991 | [142nd of 224] |
| Female population > Age 55-59 > % of the total | 2.58 | [66th of 224] |
| Female population > Age 60-64 | 21,621 | [145th of 224] |
| Female population > Age 60-64 > % of the total | 1.74 | [77th of 224] |
| Female population > Age 65-69 | 16,608 | [143rd of 224] |
| Female population > Age 65-69 > % of the total | 1.34 | [87th of 224] |
| Female population > Age 70-74 | 13,412 | [142nd of 224] |
| Female population > Age 70-74 > % of the total | 1.08 | [86th of 224] |
| Female population > Age 75-79 | 9,956 | [141st of 224] |
| Female population > Age 75-79 > % of the total | 0.8 | [89th of 224] |
| Female population > Age 80-84 | 9,764 | [138th of 224] |
| Female population > Age 80-84 > % of the total | 0.79 | [81st of 224] |
| Gender development | 0.762 | [57th of 141] |
| Gender empowerment | 0.41 | [58th of 65] |
| Male population > Age 10-14 | 53,060 | [153rd of 224] |
| Male population > Age 10-14 > % of the total | 4.28 | [143rd of 224] |
| Male population > Age 15-19 | 51,298 | [155th of 224] |
| Male population > Age 15-19 > % of the total | 4.13 | [150th of 224] |
| Male population > Age 20-24 | 49,814 | [156th of 224] |
| Male population > Age 20-24 > % of the total | 4.01 | [150th of 224] |
| Male population > Age 25-29 | 55,795 | [150th of 224] |
| Male population > Age 25-29 > % of the total | 4.5 | [35th of 224] |
| Male population > Age 30-34 | 46,406 | [150th of 224] |
| Male population > Age 30-34 > % of the total | 3.74 | [88th of 224] |
| Male population > Age 35-39 | 46,260 | [147th of 224] |
| Male population > Age 35-39 > % of the total | 3.73 | [73rd of 224] |
| Male population > Age 40-44 | 51,883 | [146th of 224] |
| Male population > Age 40-44 > % of the total | 4.18 | [32nd of 224] |
| Male population > Age 45-49 | 44,840 | [146th of 224] |
| Male population > Age 45-49 > % of the total | 3.61 | [50th of 224] |
| Male population > Age 50-54 | 37,543 | [146th of 224] |
| Male population > Age 50-54 > % of the total | 3.03 | [72nd of 224] |
| Male population > Age 55-59 | 28,841 | [145th of 224] |
| Male population > Age 55-59 > % of the total | 2.32 | [78th of 224] |
| Male population > Age 60-64 | 17,608 | [149th of 224] |
| Male population > Age 60-64 > % of the total | 1.42 | [90th of 224] |
| Male population > Age 65-69 | 12,598 | [150th of 224] |
| Male population > Age 65-69 > % of the total | 1.02 | [101st of 224] |
| Male population > Age 70-74 | 9,279 | [149th of 224] |
| Male population > Age 70-74 > % of the total | 0.75 | [100th of 224] |
| Male population > Age 75-79 | 5,919 | [149th of 224] |
| Male population > Age 75-79 > % of the total | 0.48 | [105th of 224] |
| Male population > Age 80-84 | 4,143 | [148th of 224] |
| Male population > Age 80-84 > % of the total | 0.33 | [112nd of 224] |
| Percentage living in rural areas. | 57% | [60th of 193] |
| Percentage living in urban areas | 43% | [139th of 199] |
| Persons per room | 1.2 | [21st of 60] |
| Population > CIA Factbook | 1,274,189 | [152nd of 240] |
| Population ages 0-14 > % of total | 24.58 % | [120th of 185] |
| Population ages 15-64 > % of total | 68.81 % | [31st of 185] |
| Population ages 65 and above > % of total | 6.6 % | [70th of 185] |
| Population growth > annual % | 1.11 annual % | [109th of 195] |
| Population, female > % of total | 50.4 % | [98th of 190] |
| Rights of the Child Convention > Ratification Dates | 26 Jul 1990 a | |
| Rural population | 716,113.8 | [139th of 193] |
| Rural population growth > annual % | 0.9 annual % | [70th of 193] |
| Sex ratio > 15-64 years | 1 | [110th of 223] |
| Sex ratio > sex ratios > 15–65 | 1 | [117th of 215] |
| Sex ratio > sex ratios > at birth | 1.02 | [205th of 215] |
| Sex ratio > sex ratios > over 65 | 0.64 | [188th of 215] |
| Sex ratio > sex ratios > total | 0.97 | [138th of 215] |
| Sex ratio > sex ratios > under 15 | 1.01 | [190th of 215] |
| Total Population | 1,240,827 | [153rd of 227] |
| Total population > Age 10-14 | 105,140 | [153rd of 224] |
| Total population > Age 10-14 > % of the total | 8.47 | [140th of 224] |
| Total population > Age 15-19 | 100,352 | [155th of 224] |
| Total population > Age 15-19 > % of the total | 8.09 | [151st of 224] |
| Total population > Age 20-24 | 97,514 | [156th of 224] |
| Total population > Age 20-24 > % of the total | 7.86 | [152nd of 224] |
| Total population > Age 25-29 | 109,975 | [150th of 224] |
| Total population > Age 25-29 > % of the total | 8.86 | [30th of 224] |
| Total population > Age 30-34 | 91,035 | [150th of 224] |
| Total population > Age 30-34 > % of the total | 7.34 | [93rd of 224] |
| Total population > Age 35-39 | 91,119 | [147th of 224] |
| Total population > Age 35-39 > % of the total | 7.34 | [75th of 224] |
| Total population > Age 40-44 | 103,634 | [145th of 224] |
| Total population > Age 40-44 > % of the total | 8.35 | [26th of 224] |
| Total population > Age 45-49 | 90,941 | [145th of 224] |
| Total population > Age 45-49 > % of the total | 7.33 | [47th of 224] |
| Total population > Age 50-54 | 77,410 | [145th of 224] |
| Total population > Age 50-54 > % of the total | 6.24 | [63rd of 224] |
| Total population > Age 55-59 | 60,832 | [145th of 224] |
| Total population > Age 55-59 > % of the total | 4.9 | [69th of 224] |
| Total population > Age 60-64 | 39,229 | [148th of 224] |
| Total population > Age 60-64 > % of the total | 3.16 | [83rd of 224] |
| Total population > Age 65-69 | 29,206 | [148th of 224] |
| Total population > Age 65-69 > % of the total | 2.35 | [96th of 224] |
| Total population > Age 70-74 | 22,691 | [146th of 224] |
| Total population > Age 70-74 > % of the total | 1.83 | [95th of 224] |
| Total population > Age 75-79 | 15,875 | [143rd of 224] |
| Total population > Age 75-79 > % of the total | 1.28 | [95th of 224] |
| Total population > Age 80-84 | 13,907 | [142nd of 224] |
| Total population > Age 80-84 > % of the total | 1.12 | [90th of 224] |
| Total Population > Female | 629,114 | [153rd of 227] |
| Total Population > Male | 611,713 | [152nd of 227] |
| Urban population | 527,139.3 | [150th of 195] |
| Urban population growth > annual % | 0.66 annual % | [159th of 195] |
| Urbanization | 42 | [138th of 204] |
| Urbanization in 1975 | 43.4% | [80th of 164] |
| Urbanization in 2015 | 48.6% | [110th of 164] |
| Women > Adult literacy rate females as a % of males | 92 | [74th of 144] |
| Women > Contraceptive prevalence % | 26 | [137th of 170] |
| Women > Life expectancy females as a % of males | 112 | [12th of 173] |
| Women > Maternal mortality ratio > reported | 21 | [116th of 154] |
| Women > Maternal mortality ratio adjusted | 24 | [131st of 166] |
| Women > Skilled attendant at delivery % | 99 | [40th of 172] |
| Death rate, crude > per 1,000 people | 7 per 1,000 people | [113rd of 195] |
| rate, adult, female > per 1,000 female adults | 109.97 per 1,000 female adults | [98th of 185] |
| rate, adult, male > per 1,000 male adults | 207.17 per 1,000 male adults | [86th of 185] |
| rate, infant > per 1,000 live births | 13 per 1,000 live births | [124th of 187] |
| rate, under-5 > per 1,000 | 15 per 1,000 | [127th of 187] |
| immigrant population > Immigrants as percentage of state population | 1.687 | [133rd of 195] |
| immigrant population > Number of immigrants | 21,000 | [157th of 195] |
| immigrant population > Percentage of total number of immigrants in the world | >0.1% | |
| Net migration rate | -0.09 migrant(s)/1,000 populati | [89th of 225] |
| US visa lottery winners | 44 US visa lottery winners | [97th of 178] |


| Other articles in this category |
|---|
| Mauritius at a glance |
| Geography |
| History |
| Culture |
| Economy(1) |
| Economy(2) |
| Politics |
| Military |